Who Will Be Under Water as the Seas Rise, New Report Reveals
EDITOR'S NOTE: For this project, Climate Central has worked closely with The Upshot at the New York Times, where an interactive graphic and more detailed results from our analysis can be found.
Every global shore touches the same ocean, and the ocean is rising.
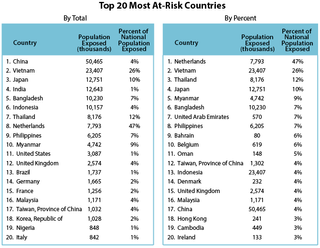
Climate Central just completed a novel analysis of worldwide exposure to sea level rise and coastal flooding. We found that 147 to 216 million people live on land that will be below sea level or regular flood levels by the end of the century, assuming emissions of heat-trapping gases continue on their current trend. By far the largest group — 41 to 63 million — lives in China. The ranges depend on the ultimate sensitivity of sea level to warming.
But even these figures may be two to three times too low, meaning as many as 650 million people may be threatened.

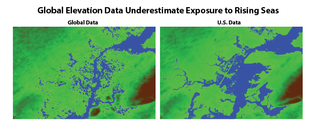
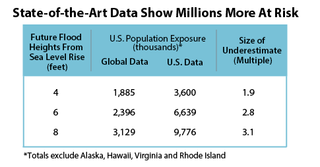
Our analysis relied on global data on elevation and population, but our experience using similar data in the U.S. strongly suggests that this global data is not as accurate or precise as more modern data sources. Comparing results for U.S. vulnerability using global data and state-of-the-art domestic data, we found that global elevation data led to major underestimates compared to modern U.S. elevation data (by a factor of 3 to 4), whereas global population data led to overestimates by a factor of 1.6 to 1.8. The net effect of global data was underestimation by a factor of 2 to 3.
If the overall error factors we calculated for the U.S. apply globally, then 300 to 650 million people live on land that will be submerged or exposed to chronic flooding, by 2100, under current emission trends.

Higher-quality global data — and in particular, elevation data — is needed to help resolve those figures — and makes a bigger difference than resolving sea level sensitivity. But our unadjusted results still give an indication of how nations compare in the threats they face from rising seas.
Sign up for the Live Science daily newsletter now
Get the world’s most fascinating discoveries delivered straight to your inbox.
The top-20 list of most exposed countries includes representatives from every continent except Australia. The top seven slots, and 12 overall, come from Asia. Five European Union members make the list, as do the U.S., Brazil, and Nigeria.
Methods
For our global analysis, we used land elevation data from the Shuttle Radar Topography Mission (SRTM); mean sea surface elevation data based on a 16-year record of satellite altimetry from the TOPEX/Poseidon mission; a global grid of mean annual maximum water level offsets developed by Merrifield et al. (2013); a global set of local sea level rise projections from Kopp et al. (2014); 2010 population data from LandScan; and national boundaries from GADM Version 2.0. We believe this global sea level exposure analysis is the first to incorporate observed sea surface elevations, to factor in mean annual maximum water levels, to tie these to land elevations, and to use probabilistic local sea level rise projections. We employed nearest neighbor approaches whenever spatial interpolation was required to match data layers. We counted as exposed all land below each water level assessed, regardless of connectivity to ocean at that level, so long as the land fell within a more broadly defined Low Elevation Coastal Zone within 10 vertical meters of the high tide line. Thus we did not count inland depressions such as the Caspian Sea Depression, but did capture apparently isolated low-lying areas, which more accurate elevation data might prove connected.

SRTM data do not cover latitudes farther north than 60 degrees or farther south than 56 degrees, slightly diminishing our exposure estimates for Canada, Russia, and the world as a whole.
For our analysis of error over the U.S., we used lidar (laser-based) coastal elevation data from NOAA, and U.S. Census population data at Census block resolution. We excluded Rhode Island and Virginia from the analysis due to gaps in SRTM data.
Research report written by Benjamin Strauss, Vice President for Climate Impacts for Climate Central, and Scott Kulp, Senior Developer and Research Associate.
Original article on ClimateCentral.
Most Popular


