In assessing the global-scale trends in near-surface (0-20 m) ocean temperatures between 1900 and 2010, Gouretski et al. (2012) determined that the world’s oceans warmed by about 1.1°C between 1900 and 1945 (~0.24°C per decade), but then only warmed by an additional net 0.3°C between 1945 and 2010 (~0.046°C per decade), including a cooling trend between 1945 and 1975.
The early 20th century warming was therefore about 4 to 5 times greater both in magnitude and rapidity as the post-1945 warming.
“Both time series show a temperature increase from 1900 to about 1945, a slight decrease to the mid-1970s, and a temperature rise to the end of the record.”
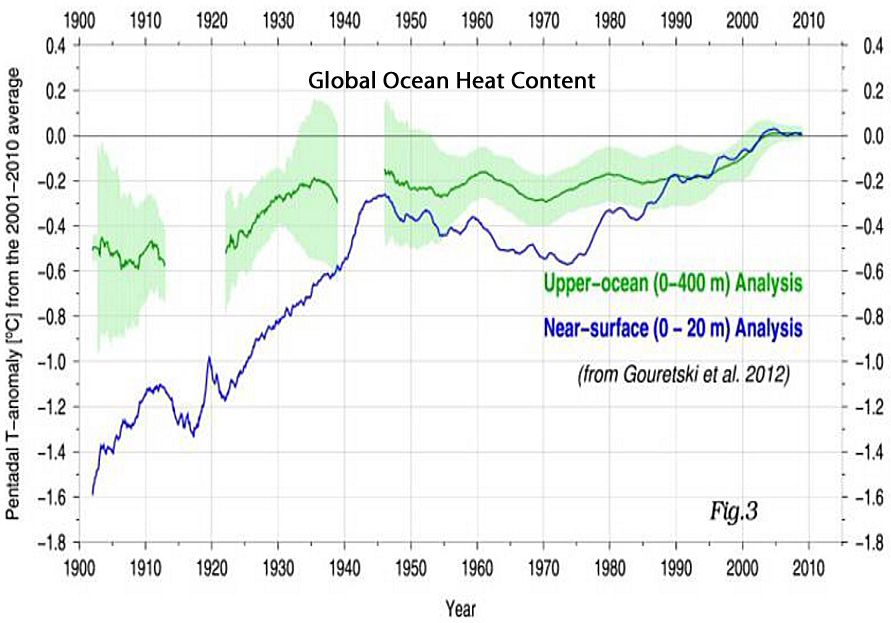

Image: University of Hamburg, Gouretski et al., 2012
Interestingly, Gouretski et al. (2012) also point out that large regions of the oceans have been cooling since the 1990s.
“Decadal mean SST and 0–20 m layer anomalies calculated relative to the reference decade 2001–2010 give evidence of the general warming of the global ocean since 1900. However, large regions of the oceans have experienced cooling since the 1990s. Whereas cooling in the tropical Eastern Pacific ocean is associated with frequent La Nina events in the past decade, the cause of the cooling within the Southern Ocean remains unknown.”
According to Riser and 26 co-authors (2016), the globe’s oceans have warmed in some places, cooled in others, and the overall net change has been a warming of a little less than 0.2°C (0-1000 m) since about 1950, or about 0.03°C per decade.

The achievement of a few tenths of a degree of added warmth over the course of the last 6 ½ decades has been realized largely because the regions of the world where the oceans have been warming have slightly exceeded the cooling regions in volume.
The net difference between the warming and cooling trends for the globe is oddly referred to as global warming even though the warming trends have not been global, but regional.
“Most regions of the world ocean are warmer in the near-surface [0-700 m] layer than in previous decades, by over 1° C in some places. A few areas, such as the eastern Pacific from Chile to Alaska, have cooled by as much as 1° C, yet overall the upper ocean has warmed by nearly 0.2° C globally since the mid-twentieth century.”
According to climate models and anthropogenic global warming theory, it has been expected that a long-term, gradually rising warming trend in the world-wide ocean would follow the trends associated with the rise of CO2 emissions.
The the oceans have not cooperated.
Instead, the world’s regional oceans have followed a decadal-scale variability, with pronounced warming and cooling episodes. The lack of consistency with climate models has thus led scientists to conclude that it is “very difficult to determine whether significant anthropogenic change in [regional 0-2000 m ocean temperatures] … have occurred” (Yashavaev and Loder, 2017).
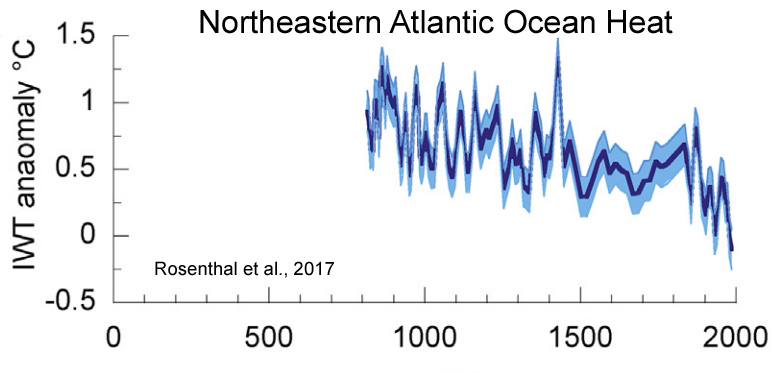
Below are several examples of the wide swaths of the Earth where ocean cooling (or non-warming) has been ongoing for at least the last decade to last several decades, including the North Atlantic Ocean, Pacific Ocean, Southern Ocean, and Indian Ocean.
North Atlantic
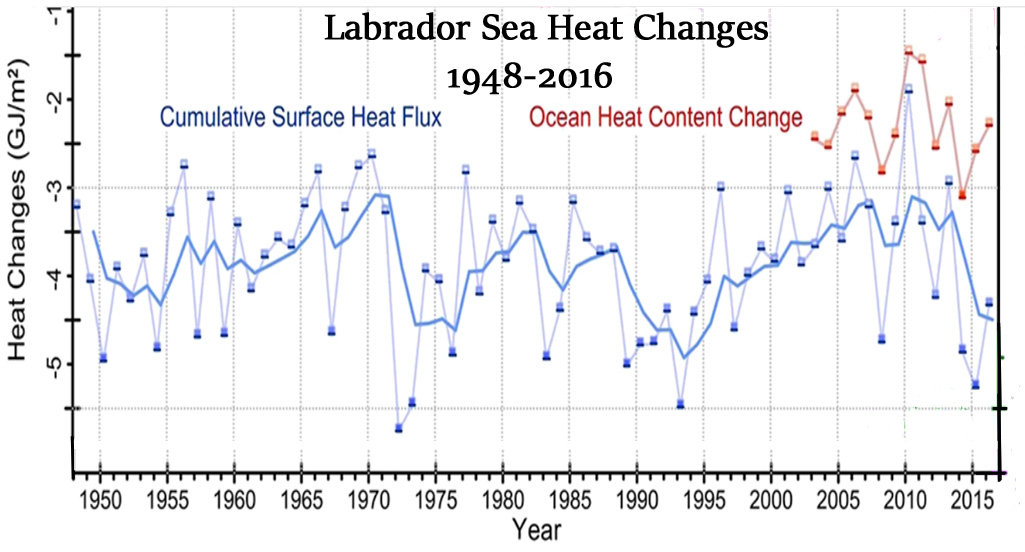
“As a result of this intermittent recurrence of intensified Labrador Sea Water formation, the annual average temperature and density in the region’s upper 2000m have predominantly varied on a bi-decadal time scale, rather than having a long-term trend as might be expected from anthropogenic climate change. … [I]ntermittent recurrence of enhanced deep convection periods in the Labrador Sea, and the associated formation of major LSW classes, are contributing to a predominant decadal-scale variation in hydrographic properties which makes it difficult to determine whether anthropogenic changes are occurring. … This strong, apparently natural, decadal-scale variability makes it very difficult to determine whether significant anthropogenic changes in LSW formation and properties have occurred.”

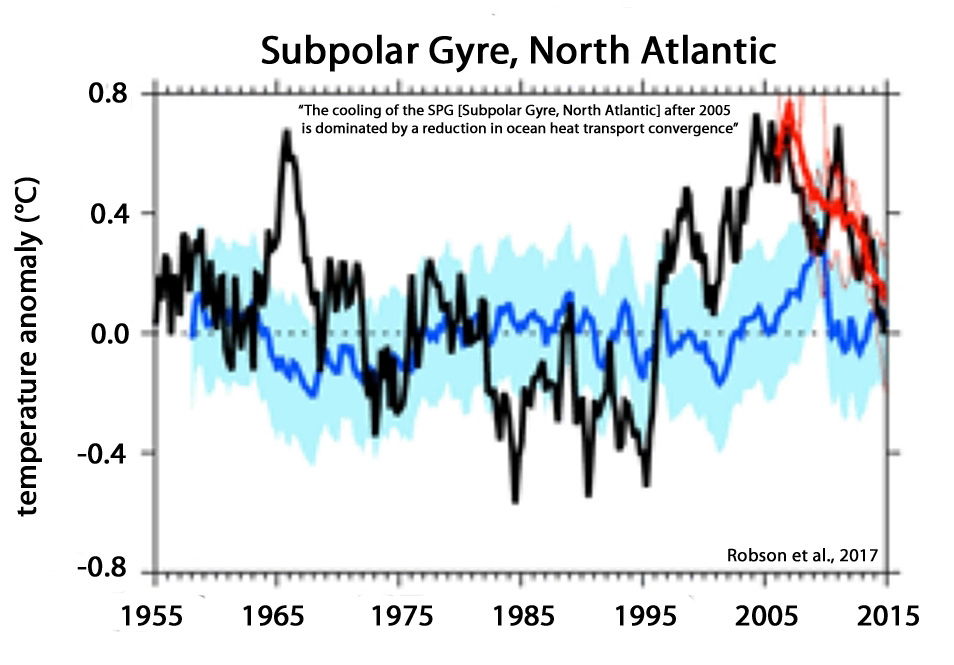
“In the 1990s anomalously strong ocean heat transport convergence dominates the SPG [Subpolar Gyre, North Atlantic] warming. … The cooling of the SPG [Subpolar Gyre, North Atlantic] after 2005 is dominated by a reduction in ocean heat transport convergence, particularly in the eastern SPG. The reduced ocean heat transport is largely due to a weakening ocean circulation. By focusing on three independent case-studies of North Atlantic decadal change events the analysis presented here gives further support to the important role of ocean heat transport and ocean circulation in driving the observed changes in North Atlantic ocean heat content in the recent past.”
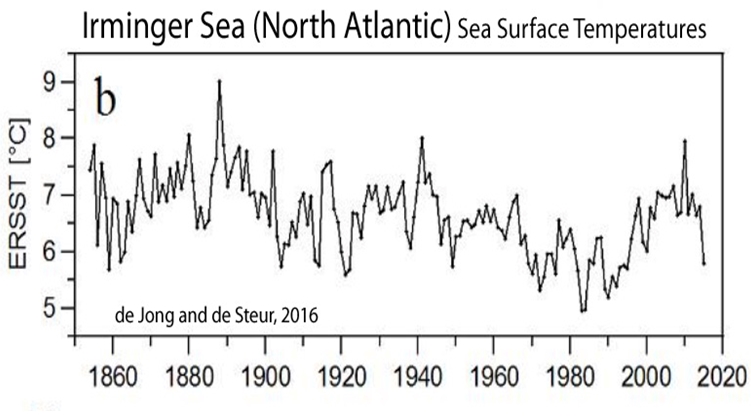
“After 2010, a sharp and stable freshening and cooling of SPMWs [Subpolar Mode Water] started in the eastern part of the North Atlantic. In the years 2010–2016, the mean temperature of the SPMW [Subpolar Mode Water] core in the Rockall Trough dropped by -0.73°C (-0.12°C/yr); in the Iceland Basin it dropped by -2.12°C (-0.35°C/yr), and salinity decreased by 0.12 psu (0.02 psu/yr) and 0.23 psu (0.04 psu/yr), respectively.”

Pacific Ocean
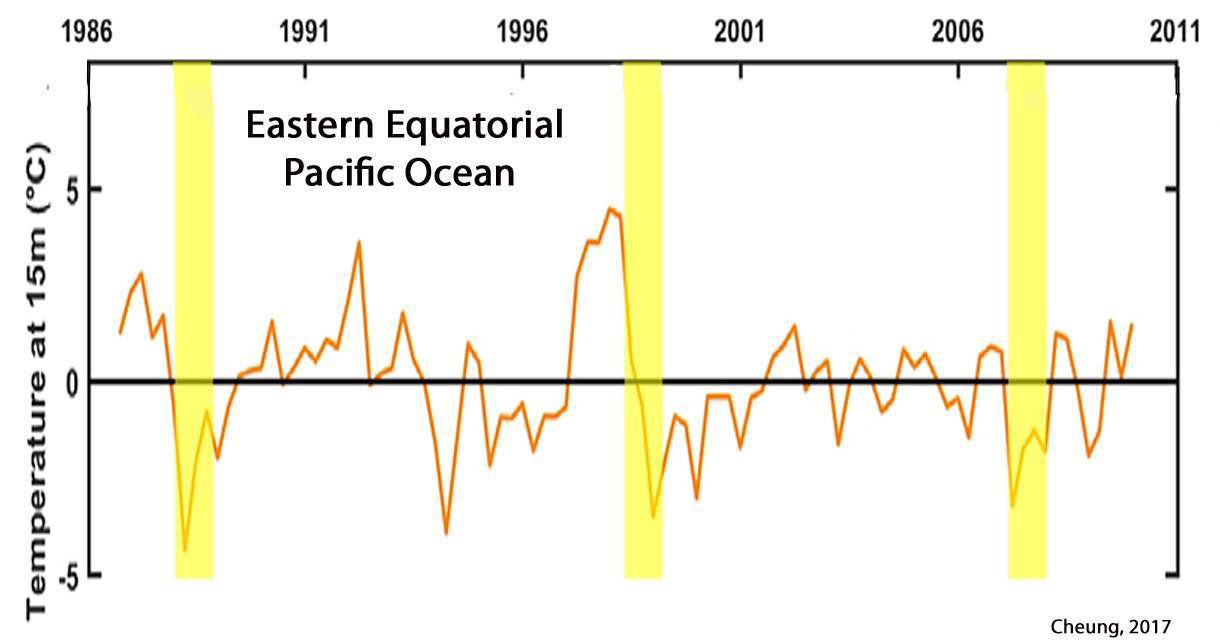

“In the Southern Ocean, the increasing trend of the total OHC slowed down and started to decrease from 1980, and it started to increase again after 1995. In the warming context over the whole period [1970-2009], the Pacific was losing heat, especially in the deep water below 1000 m and in the upper layer above 300 m, excluding the surface 20 m layer in which the OHC kept increasing through the time.”
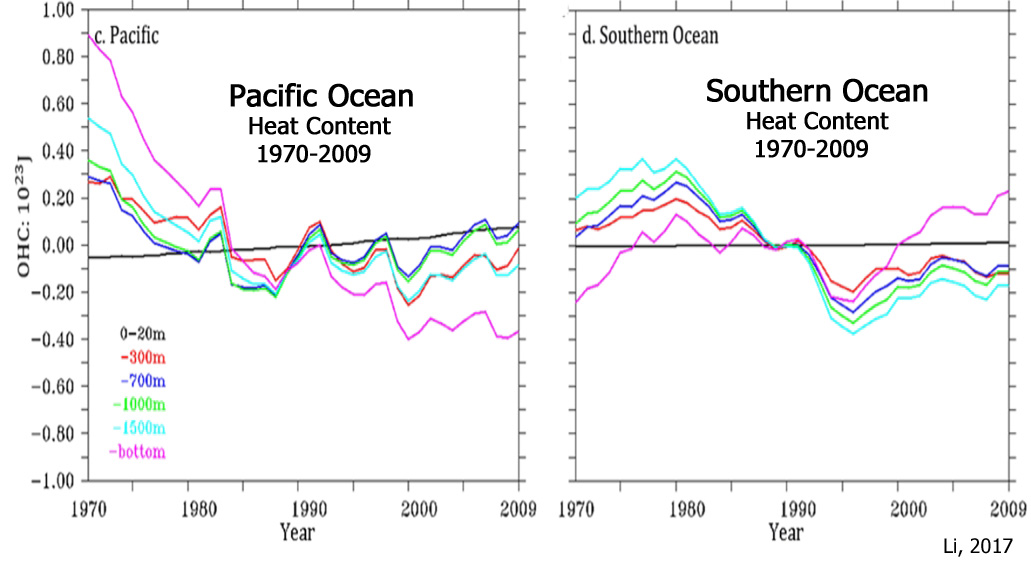
Southern Ocean
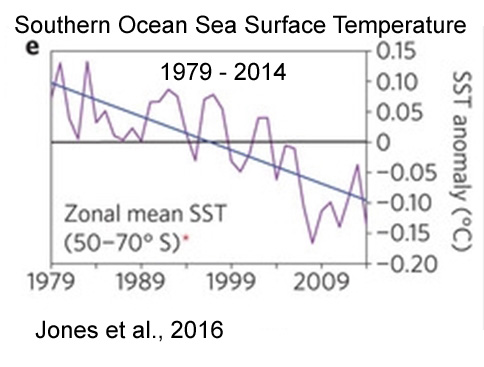
“In contrast to a strong decrease in Arctic sea ice extent, overall Antarctic sea ice extent has modestly increased since 1979. Several hypotheses have been proposed for the net Antarctic sea ice expansion, including atmosphere/ocean circulation and temperature changes, sea ice-atmospheric-ocean feedback, increased precipitation, and enhanced basal meltwater from ice shelves. Concomitant with this positive trend in Antarctic sea ice, sea surface temperatures (SSTs) over the Southern Ocean south of approximately 45°S have cooled over this period [since 1979].”
“The Southern Ocean featured some remarkable changes during the recent decades. For example, large parts of the Southern Ocean, despite rapidly rising atmospheric greenhouse gas concentrations, depicted a surface cooling since the 1970s, whereas most of the planet has warmed considerably. In contrast, climate models generally simulate Southern Ocean surface warming when driven with observed historical radiative forcing. The mechanisms behind the surface cooling and other prominent changes in the Southern Ocean sector climate during the recent decades, such as expanding sea ice extent, abyssal warming, and CO2 uptake, are still under debate. Observational coverage is sparse, and records are short but rapidly growing, making the Southern Ocean climate system one of the least explored. It is thus difficult to separate current trends from underlying decadal to centennial scale variability.”
“Occupying about 14% of the world’s surface, the Southern Ocean plays a fundamental role in ocean and atmosphere circulation, carbon cycling and Antarctic ice-sheet dynamics. … As a result of anomalies in the overlying wind, the surrounding waters are strongly influenced by variations in northward Ekman transport of cold fresh subantarctic surface water and anomalous fluxes of sensible and latent heat at the atmosphere–ocean interface. This has produced a cooling trend since 1979.”
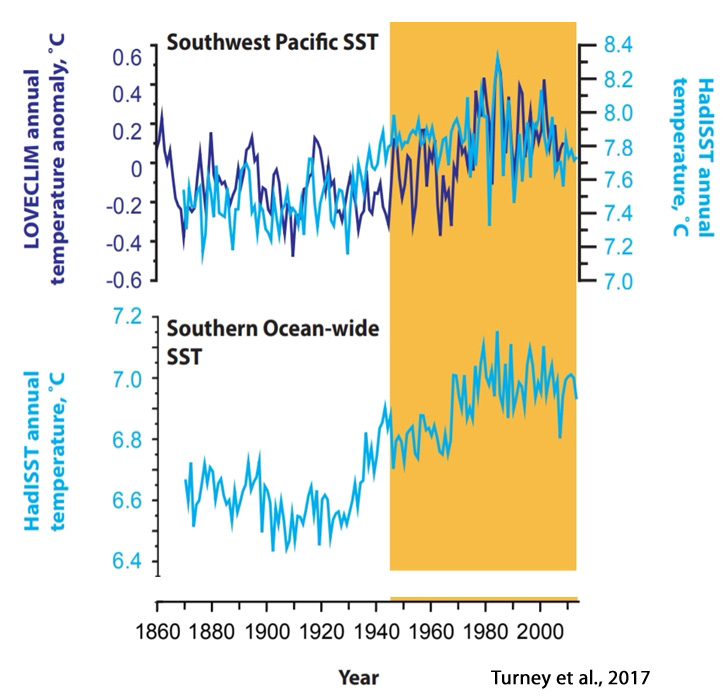
Indian Ocean
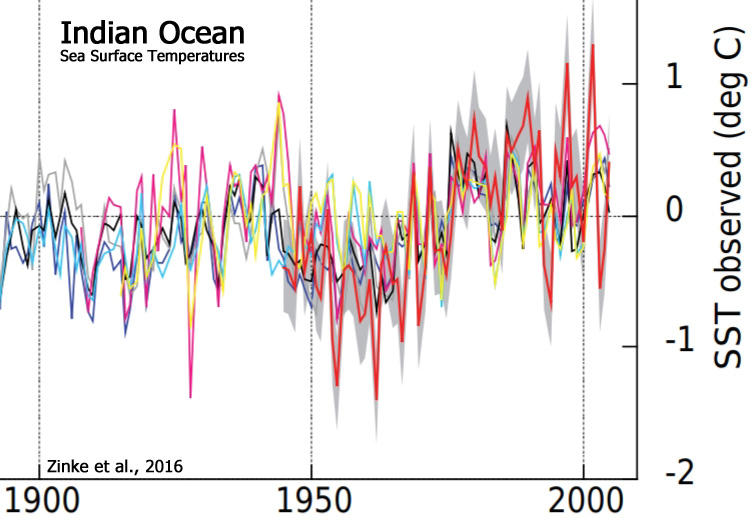
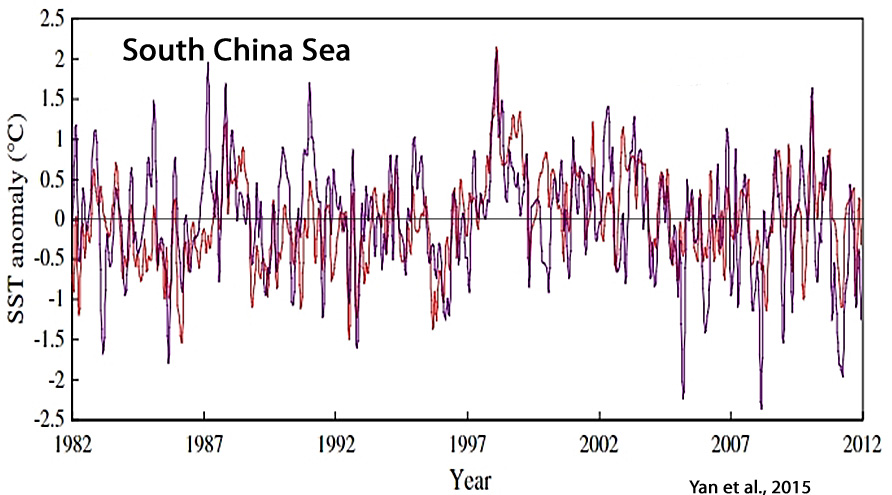
Both The Cooling And The Warming Trends For Recent Decades Follow Natural Oscillatory Patterns, Not Trends In Anthropogenic CO2 Emissions
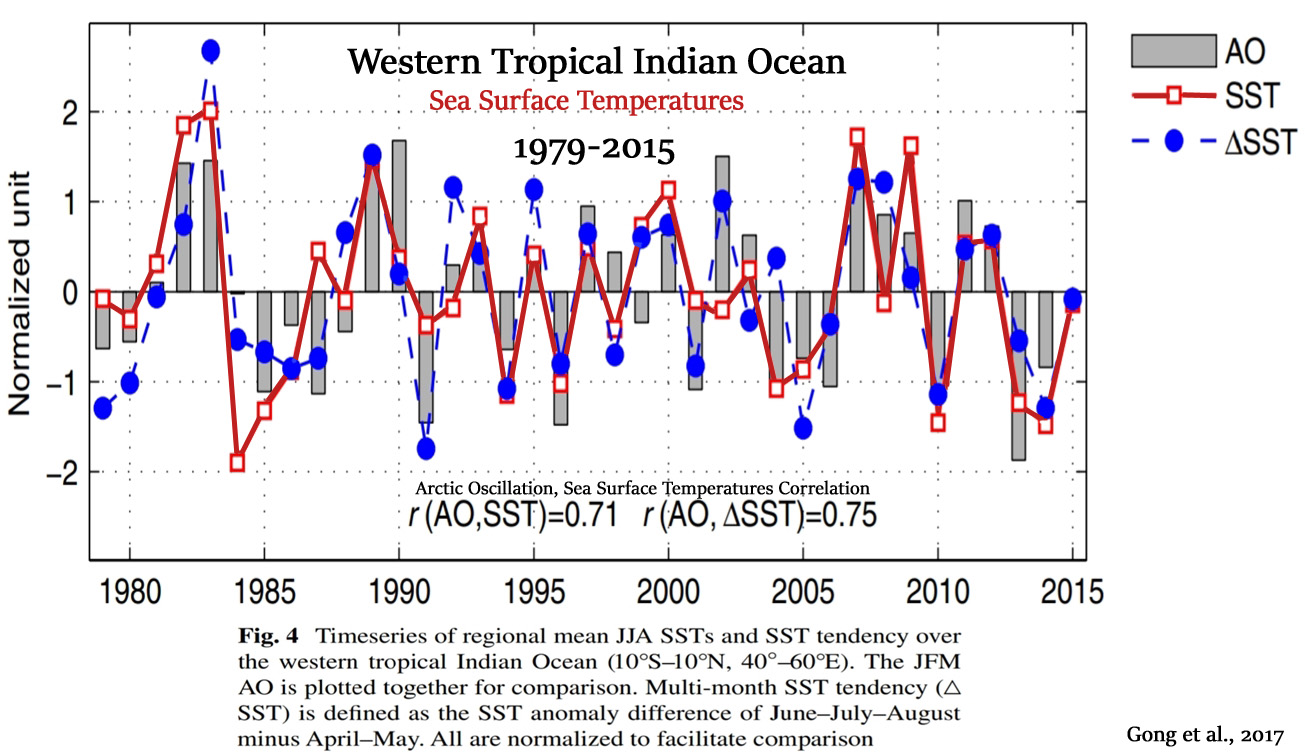
“The inter-annual relationship between the boreal winter Arctic Oscillation (AO) and summer sea surface temperature (SST) over the western tropical Indian Ocean (TIO) for the period from 1979 to 2015 is investigated. The results show that the January–February–March AO [Arctic Oscillation] is significantly correlated with the June–July–August SST and SST tendency. … The multi-month SST tendency, i.e., the SST difference of June–July–August minus April–May, is correlated with the winter AO at r = 0.75.Investigation of the regional air–sea fluxes and oceanic dynamics reveals that the net surface heat flux cannot account for the warming, whereas the oceanic Rossby wave plays a predominant role. During positive AO winters, the enhanced Arabian High causes stronger northern winds in the northern Indian Ocean and leads to anomalous cross-equatorial air-flow. … The winter AO-forced Rossby wave propagates westward and arrives at the western coast in summer, resulting in the significant SST increase.”
“It is well known that most short term global temperature variability is due to the well-defined ENSO natural oscillation (see: Wang and Fiedler, 2006). During strong El Niño events global average temperature rises by a few tenths Kelvin and reverts back subsequently. … The residual dynamics left after adjusting global surface temperature anomalies (1950-2014) for short-term variability from El Niño Southern Oscillation (ENSO) and volcanic eruptions have a staircase pattern. Linear trends for three quasi-stable periods 1950-1987, 1988-1997 and 1998-2014 are near zero with nearly all warming occurring during two step-like shifts in the years 1987/1988 and 1997/1998. A notable consequence of the staircase dynamics of recent warming is that observed temperature anomalies (HadCRUT4.5) from 1950 till 2014 could be almost reproduced as the linear sum of only two factors(!) : ENSO variability and the staircase function.”
“During the past three decades, the most rapid warming at the surface has occurred during the Arctic winter. By analyzing daily ERA-Interim data, we found that the majority of the winter warming trend north of 70°N can be explained by the trend in the downward infrared radiation (IR). This downward IR trend can be attributed to an enhanced poleward flux of moisture and sensible heat into the Arctic by poleward propagating Rossby waves, which increases the total column water and temperature within this region.”
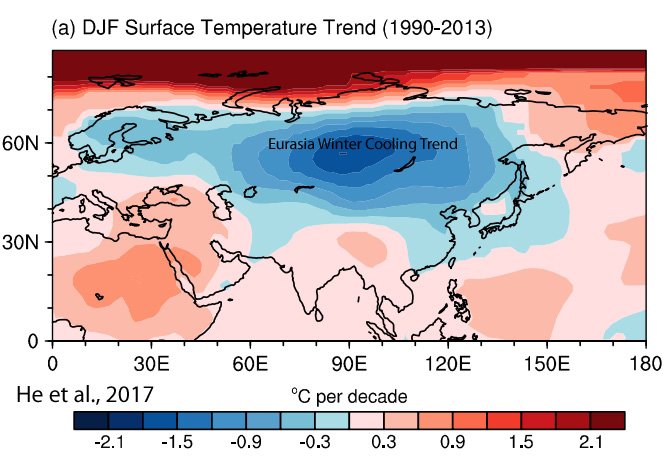
“As pointed out by Cohen et al. (2014) that continental winter SAT [surface temperature] trends since 1990 exhibit cooling over the midlatitudes. The negative trends extend from Europe eastward to East Asia, with a center of maximum magnitude to the west of the Baikal. As reviewed above, the AO/NAO [Arctic Oscillation/North Atlantic Oscillation] shows an in-phase relationship with the SAT [surface temperatures] over Eurasia. … [T]he negative trend in the AO/NAO might explain the recent Eurasian winter cooling. … Additionally, the relationship between the winter AO and surface-climate anomalies in the following spring might be modulated by the 11-year solar cycle (Chen and Zhou, 2012). The spring temperature anomalies in northern China related to the previous winter AO were larger and more robust after high solar cycle winters. However, spring temperature anomalies became very small and insignificant after the low solar cycle winters. … Numerous atmospheric scientists have documented that the AO could impact significantly the climate over Europe and Far East. … It is evident that a positive winter AO causes warmer winters over East Asia through enhancing Polar westerly jet which prevents cold Arctic air from invading low latitudes.”
“The enhanced warming observed in the Eastern China Coastal Waters (ECCW) during the last half-century has received considerable attentions. However, the reason for this warming is still a subject of debate. Based on four different Sea Surface Temperature datasets, we found that the most significant warming occurred in boreal winter during 1982–1998, although the warming trends derived from these datasets differ in magnitude. We suggest that the rapid warming during winter is a result of the asymmetry in the El Niño–Southern Oscillation teleconnection, through which El Niño events induce significant warming over the ECCW at its peak, whereas La Niña events fail to do the opposite that would completely reverse the trends; in addition, there were more El Niño than La Niña events during the recent decades. All these contribute to the winter warming during 1982–1998.”
“[T]he 1940-1978 decrease in CONUS [continental U.S.] temperatures was caused more by the negatively trending oscillatory modes of the AMO/PDO than other factors, and the 1978-2001 increase in temperatures was caused more by the positively trending oscillatory modes of the same oscillations. The small increase, or rather stagnant nature in U.S. CONUS temps since 2001, was likely due to peaking positive modes of the AMO/PDO. In the same way that the AMO and PDO can modify the regional temperatures, we see the same types of effects on precipitation, snowfall and drought in the different regions of the U.S. … It was not until 2003 (Anastasios, Swanson, & Kravtsov, 2003, 2007) that models were created that suggested that these cycles, namely the Pacific Decadal Oscillation (PDO) and the Atlantic Multidecadal Oscillation (AMO) synchronized with each other. Using this as a base, we can explain the major climate shifts that have occurred since scientists began collecting data in the late 1800’s: 1908, 1932, 1973, and 2000. While the most noticeable change in these shifts was on global temperature, effects on the regional, sensible weather in the U.S. were also identified in these same time frames. Through analysis it has been theorized that these shifts are caused by the oceans, and are in fact the main drivers of the climate, and the sensible weather experienced in the United States (Klotzbach & Gray, 2009).”
“The wintertime Arctic temperature decreased from 1979 to 1997 and increased rapidly from 1998 to 2012, in contrast to the global mean surface air temperature [which] increased between 1979 and 1997, followed by a hiatus… A recent study suggests a possible role of the Pacific Ocean decadal oscillation in regulating wintertime climate in the Arctic (Screen and Francis 2016). … The ‘‘greenhouse effect’’ of water vapor and clouds [CO2 not mentioned as contributing to the GHE] may amplify the effect of winds on Arctic winter climate. … The objectives of this study are to assess how much natural–internal variability has contributed to climate changes in these [Arctic] regions from 1979 to 2012 … In summary, the correlation analyses presented in this paper shows a natural mode of Arctic winter variability resulting from the Nordic–Siberian seesaw of meridional winds […] is associated with two-thirds of the interannual variance [cooling-warming] of winter-mean Arctic temperature between 1979 and 2012, and possibly contributed a substantial fraction of the observed Arctic amplification [1998-2012 warming] in this period.”

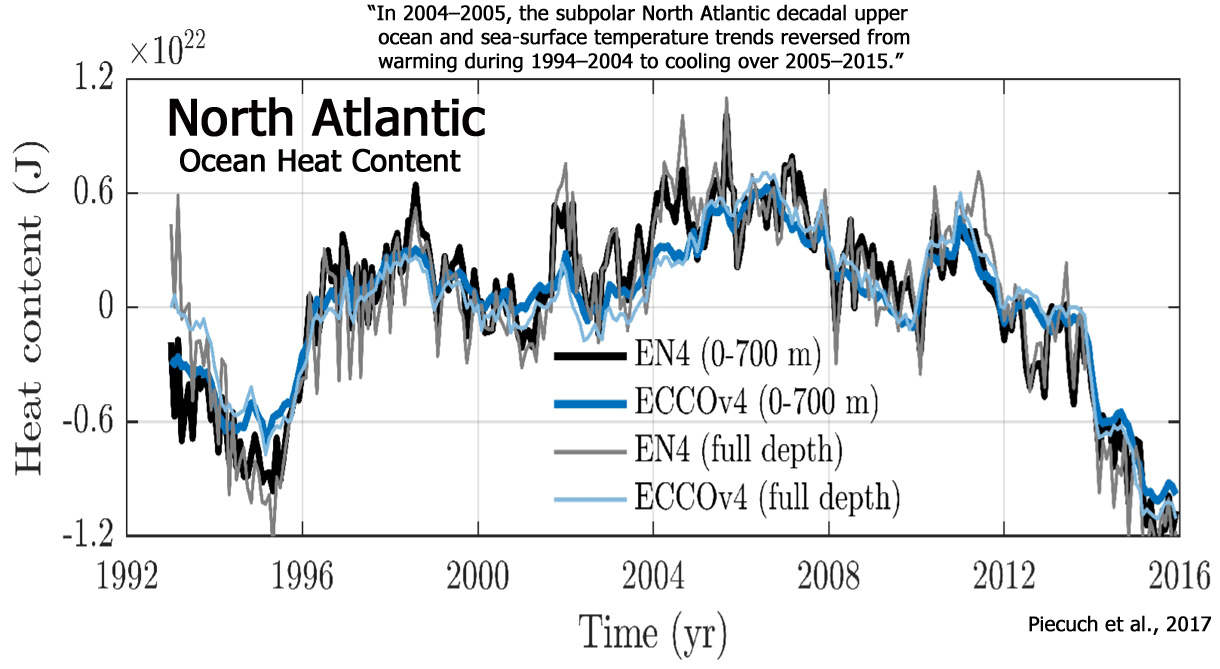
“The subpolar North Atlantic (SPNA) is subject to strong decadal variability, with implications for surface climate and its predictability. In 2004–2005, SPNA decadal upper ocean and sea-surface temperature trends reversed from warming during 1994–2004 to cooling over 2005–2015. … Over the last two decades, the SPNA has undergone a pronounced climate shift. Decadal OHC and SST trends reversed sign around 2004–2005, with a strong warming seen during 1994–2004 and marked cooling observed over 2005–2015. These trend reversals were pronounced (> 0.1 °C yr−1 in magnitude) in the northeastern North Atlantic (south and west of Iceland) and in the Labrador Sea. … To identify basic processes controlling SPNA thermal variations, we diagnose the SPNA heat budget using ECCOv4. Changes in the heat content of an oceanic control volume can be caused by convergences and divergences of advective, diffusive, and surface heat fluxes within the control volume. [Advective heat convergence] explains 87% of the total [ocean heat content] variance, the former [warming] showing similar decadal behavior to the latter [cooling], increasing over 1994–2004, and decreasing over 2005–2015. … These results demonstrate that the recent SPNA decadal trend reversal was mostly owing to advective convergences by ocean circulation … decadal variability during 1993–2015 is in largest part related to advection by horizontal gyres.”


Interesting.. Seems that the Trump administration is well aware of the THREAT that AGW agenda lobby poses to USA and world security.
Hopefully the message will finally get out about the DAMAGE being done by this ludicrous, anti-CO2, anti-development, anti-science, ANTI-LIFE agenda. !!
http://www.breitbart.com/national-security/2017/12/18/trump-national-security-strategy-doesnt-ignore-climate-change-names-climate-change-lobby-threat/
I like Trump more and more.
Another lot of science papers given the light of publicity from Kenneth Richard.
Well done Kenneth! And if I don’t get to say it later – have a Merry Christmas! 🙂
Yep, keep up the good work Kenneth.
And to all of you CARBON-based human entities that know where your food comes from….
Have a Merry Christmas and a great WINNING New Year
[…] Read more at notrickszone.com […]
Lots of cooling in the SH oceans.
Strong La Nina forming
http://www.ospo.noaa.gov/data/sst/anomaly/2017/anomnight.12.18.2017.gif
Again a nice collection of information Kenneth!
Ole Humlum has a wide collection of ocean temperature measurements:
http://www.climate4you.com/SeaTemperatures.htm
that also gives an interesting picture of lack of warming in large parts of oceans.
[…] 25 Papers: Natural Forcing Explains Why Oceans Have Been Recently Warming & Cooling […]