120 Graphs, 90 New Papers

It was four months ago that an article entitled 80 Graphs From 58 New (2017) Papers Invalidate Claims Of Unprecedented Global-Scale Modern Warming appeared on this website. The article received international attention and was “shared” tens of thousands of times.
In the last 4 months, 40 more graphs taken from 30 more new peer-reviewed scientific papers have made their way into the ever-growing volume of evidence that today’s climate is not only not unprecedented or unusual in the context of the last millennium, but modern temperature values are still among the coldest of the last 10,000 years.
In other words, there is nothing unprecedented or unusual about today’s climate. Modern temperatures are still well within range of what has occurred naturally.
The roughly 3 dozen papers and graphs that have appeared in the scientific literature since the original list appeared 4 months ago are shown below.
The full list of 120 graphs from 90 new papers for 2017 can be found here:
‘Global’ Warming Disputed: 350 Graphs
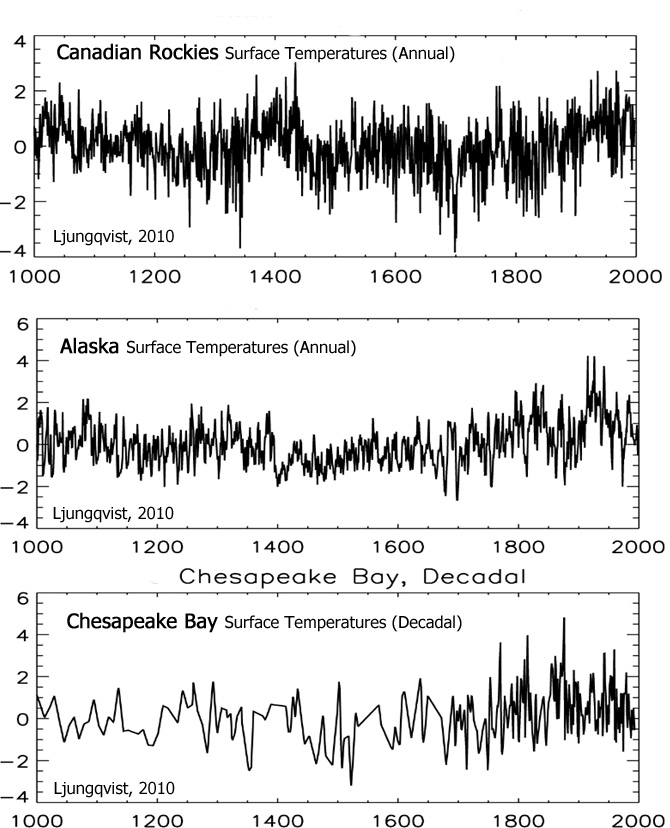
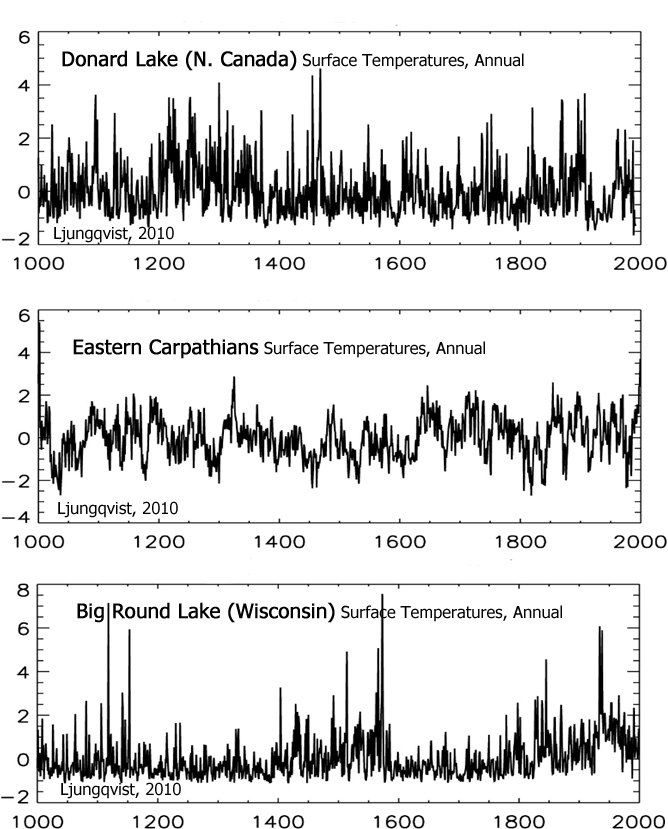
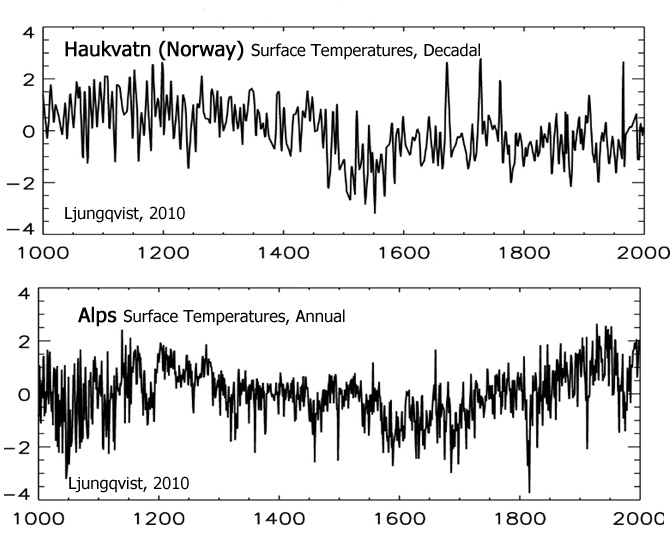
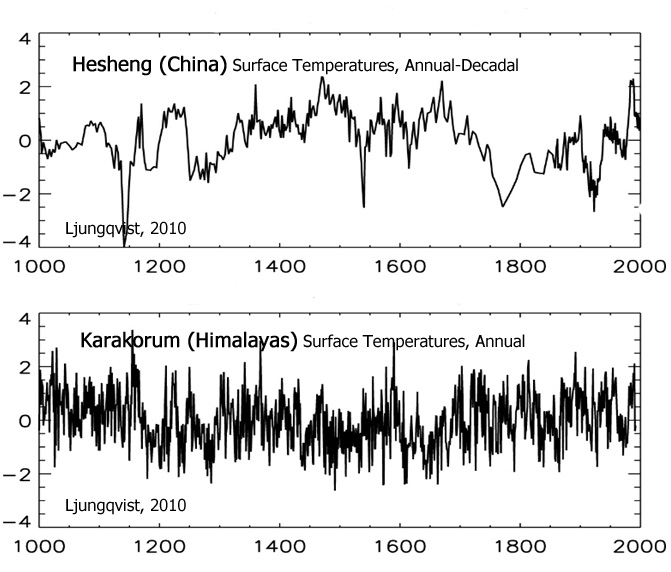
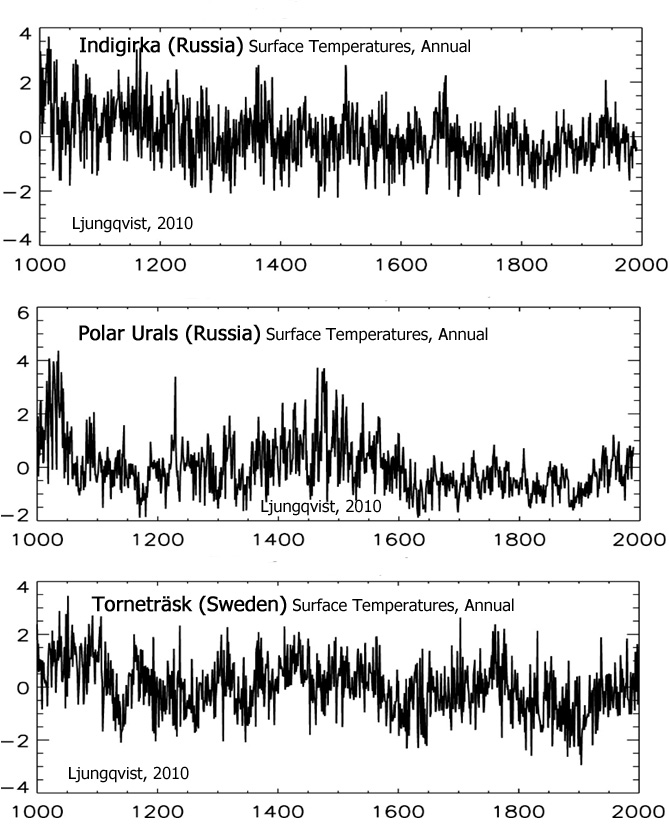
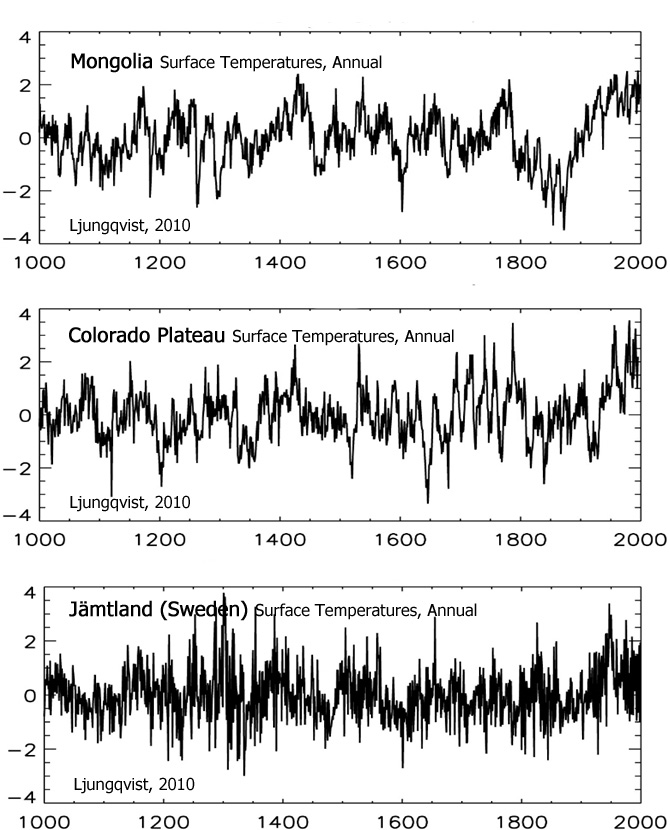
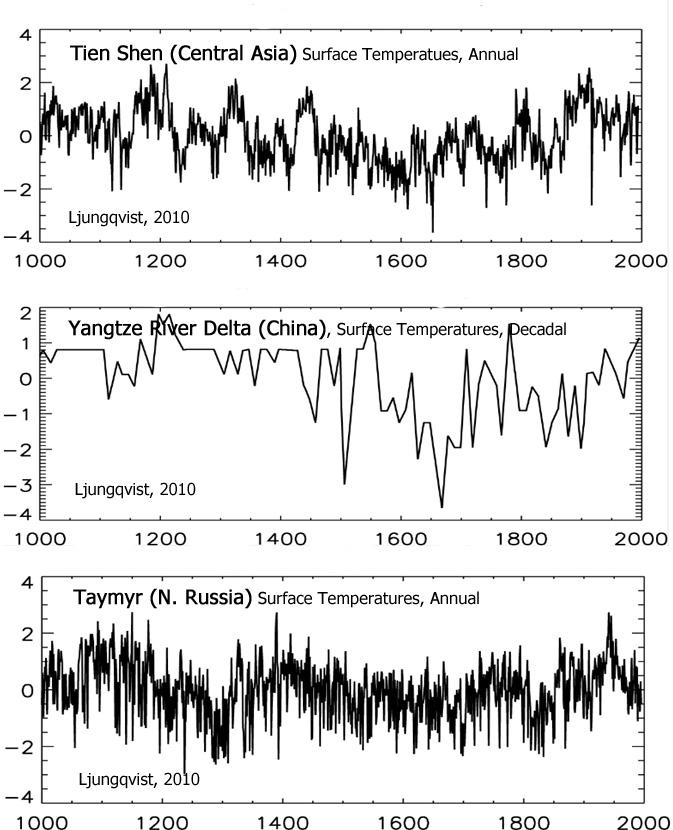
A few late Northern Hemisphere additions to the 2016 volume can also be found below, as well as some recent additions to the list of 350 papers taken from the Ljungqvist (2010) Northern Hemisphere conglomeration.
![]()
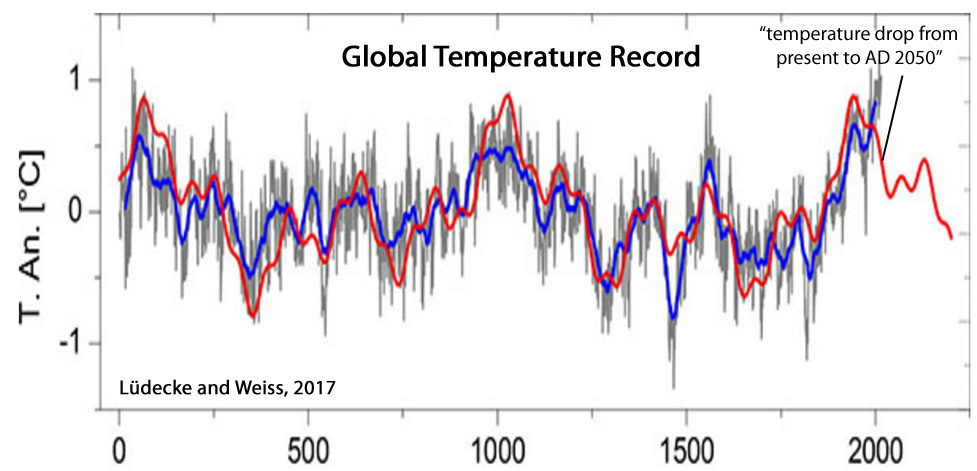
Lüdecke and Weiss, 2017
“By wavelet analysis, a new proof has been provided that at least the ~190-year climate cycle has a solar origin. … G7 [global temperature over the last 2000 years], and likewise the sine representations have maxima of comparable size at AD 0, 1000, and 2000. We note that the temperature increase of the late 19th and 20th century is represented by the harmonic temperature representation, and thus is of pure multiperiodic nature. It can be expected that the periodicity of G7, lasting 2000 years so far, will persist also for the foreseeable future. It predicts a temperature drop from present to AD 2050, a slight rise from 2050 to 2130, and a further drop from AD 2130 to 2200.”
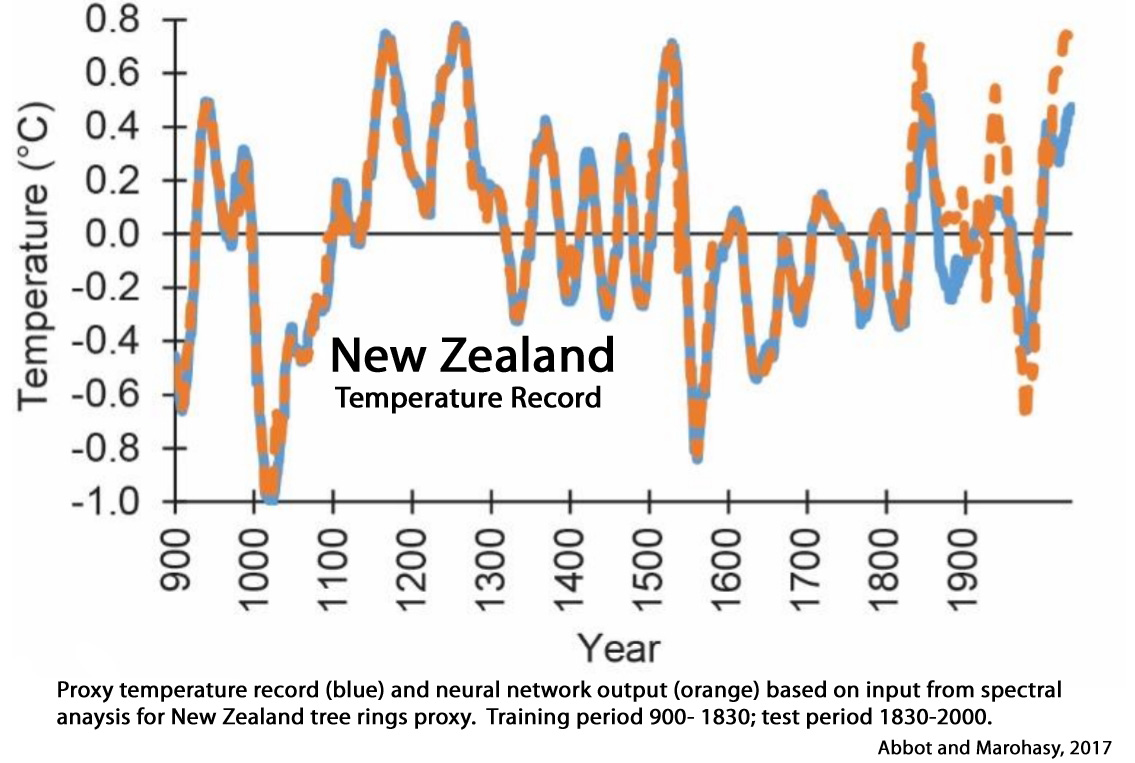
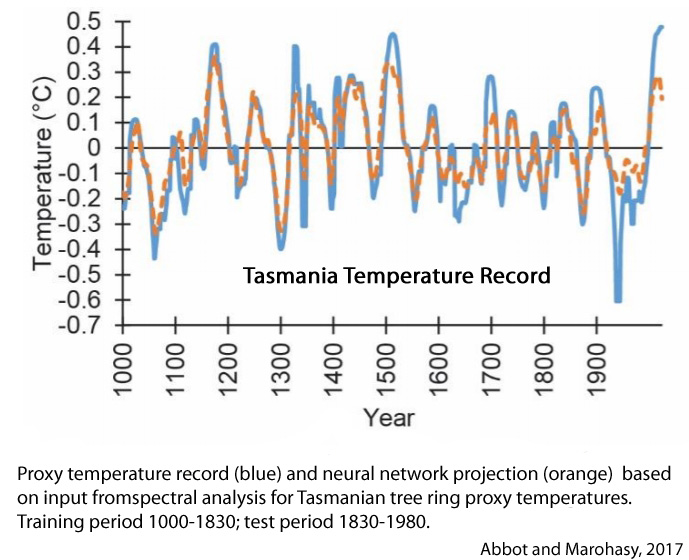
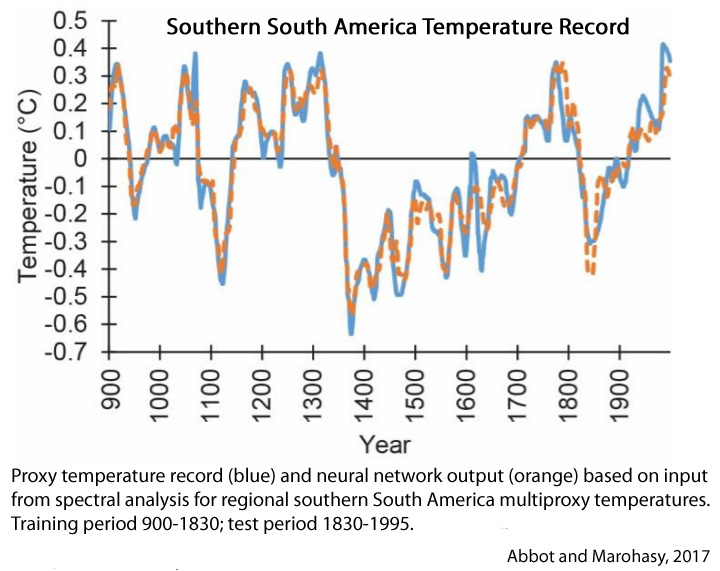
Abbot and Marohasy, 2017
The proxy measurements suggest New Zealand’s climate has fluctuated within a band of approximately 2°C since at least 900 AD, as shown in Figure 2. The warming of nearly 1°C since 1940 falls within this band. The discrepancy between the orange and blue lines in recent decades as shown in Figure 3, suggests that the anthropogenic contribution to this warming [1°C since 1940] could be in the order of approximately 0.2°C. [80% of the warming since 1940 may be due natural factors]. … [T]he increase in temperature over the last 100 years can be largely attributed to natural phenomena.
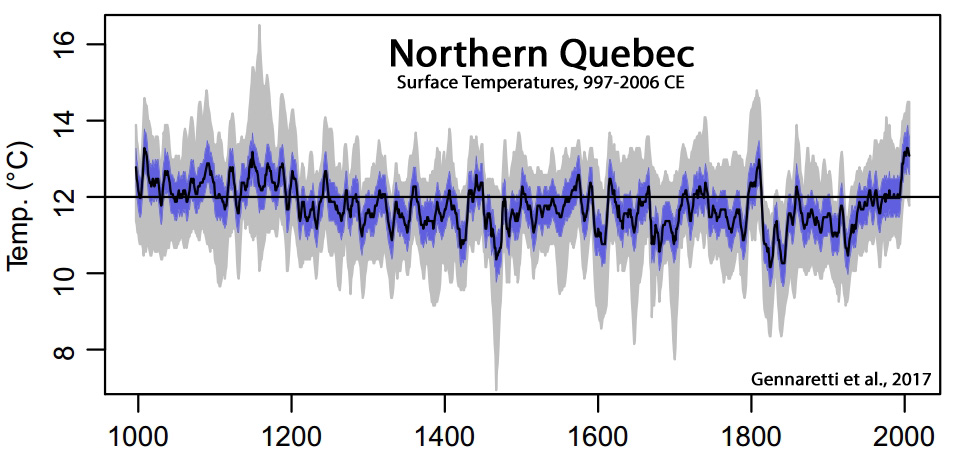
Gennaretti et al., 2017
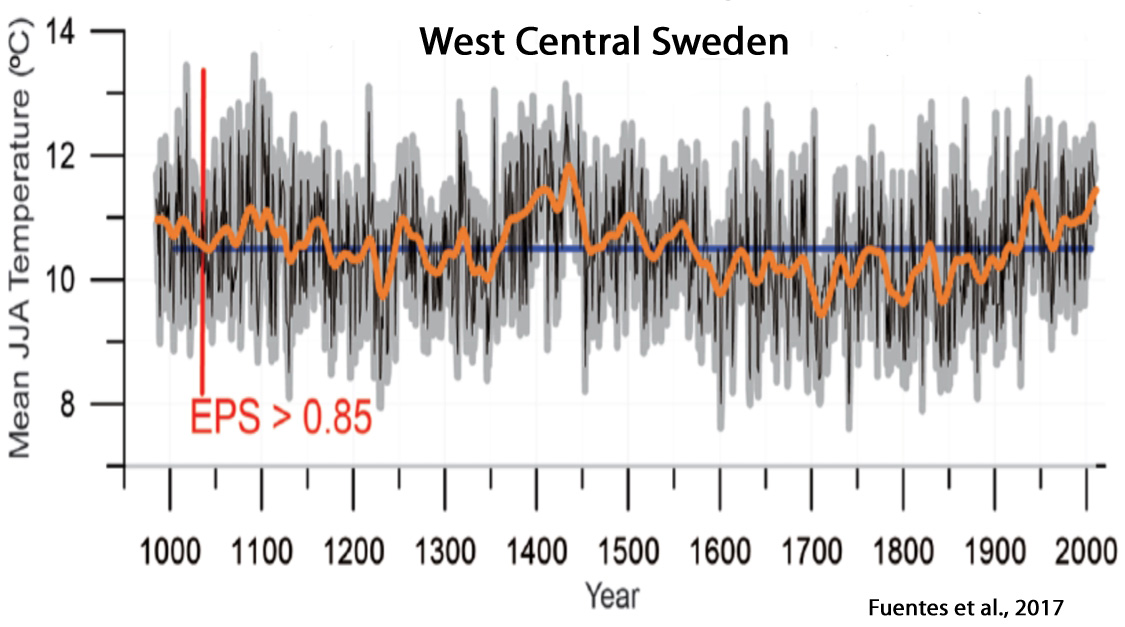
Fuentes et al., 2017
“The summer (June through August) temperature reconstruction, extending back to 1038 CE, exhibits three warm periods in 1040–1190 CE, 1370–1570 CE and the 20th century and one extended cold period between 1570 and 1920 CE.”
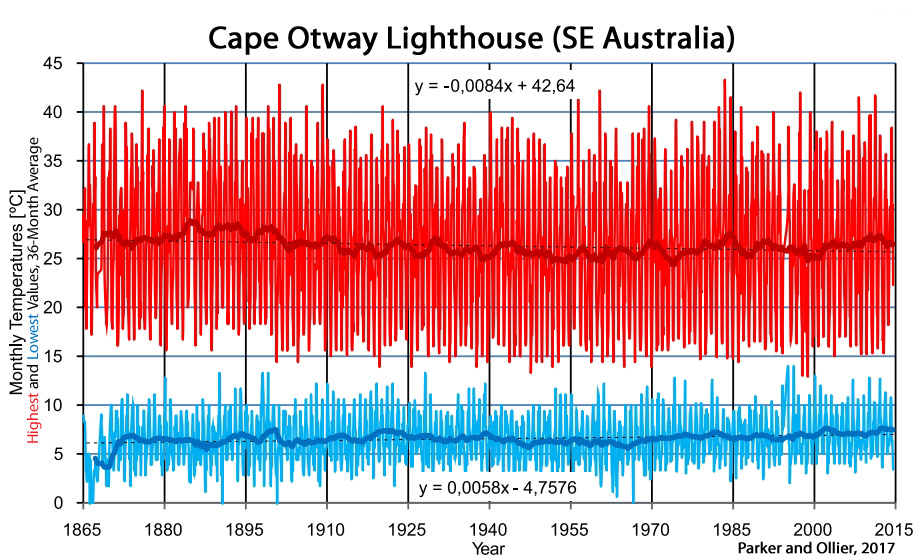
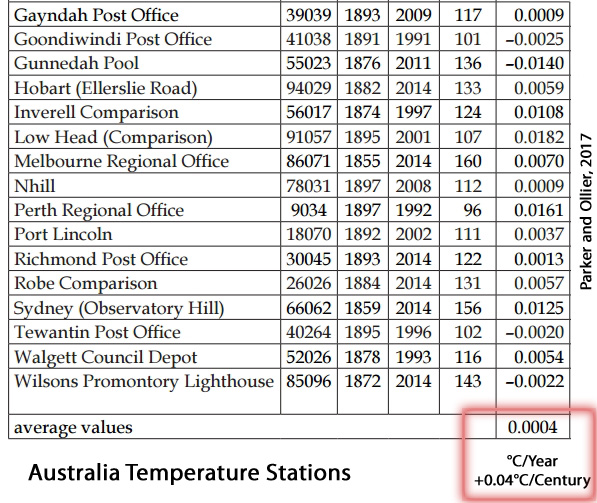
Parker and Ollier, 2017
“ In the centre of Australia, all the stations available in a circle of radius 1,000 km were showing very little or no warming, as still acknowledged in the GHCN v2 data set up to October 2011 (Fig. 6). … Table 1 presents the warming trend for the 30 longest temperature records of Australia collected in a single location, with measurements started before 1900 and continued until after 1985. … In the 30 locations, the monthly mean maximum temperature is warming 0.0004°C/year, or 0.04°C/century. That means there is no change within the limits of accuracy of the measurements.“

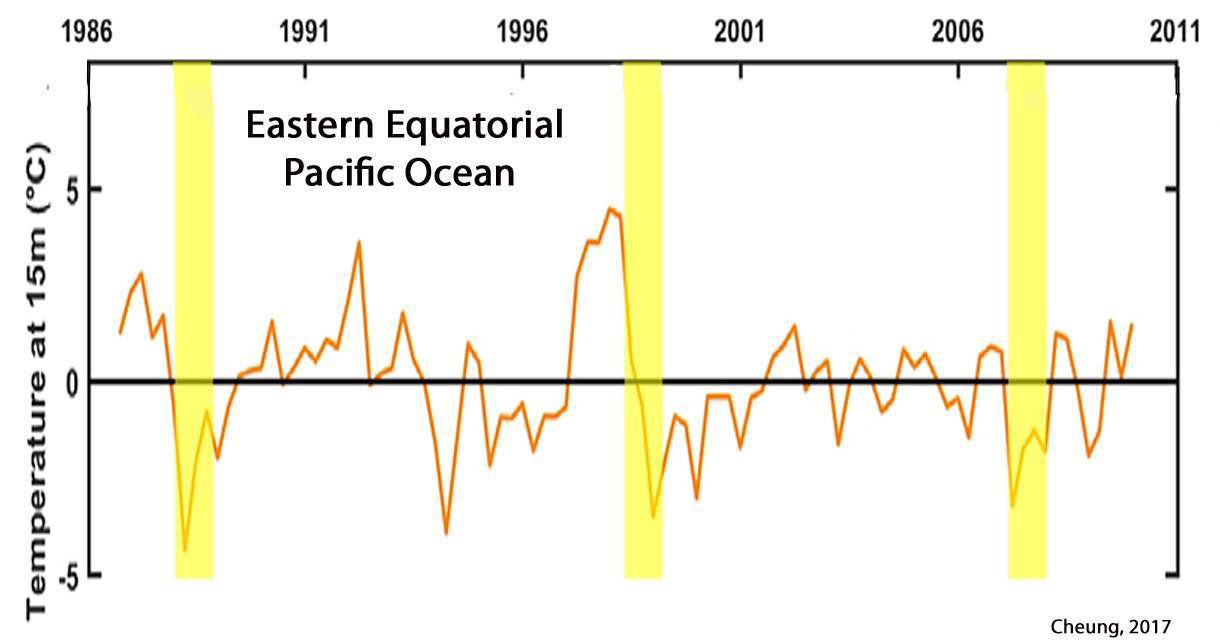
Cheung, 2017
Werner et al., 2017

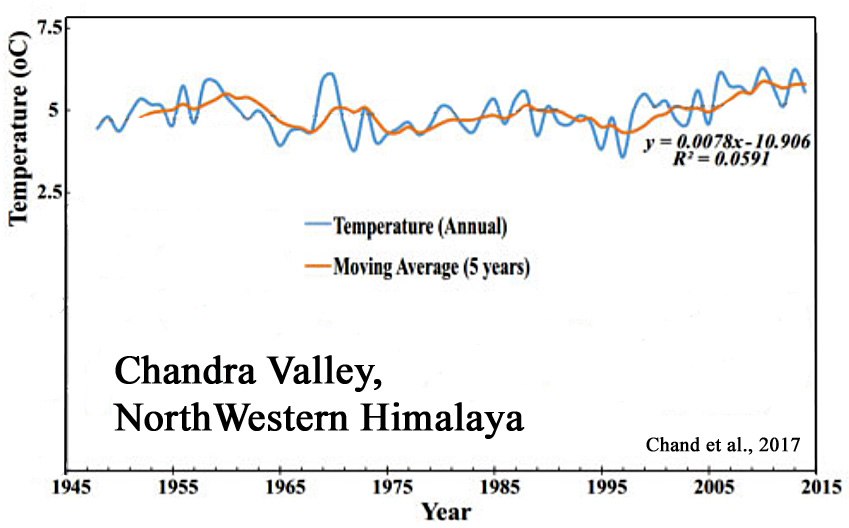
Chand et al., 2017
“Introduction: The LIA [Little Ice Age] is a globally documented cooling event that began around the 13th or 14th century and culminated between the mid- 16th and mid-19th centuries. Although the cause of LIA glaciation is not fully understood, climatologists contend that reduced solar output, changes in atmospheric circulation as a result of a reversal of the North Atlantic Oscillation and explosive volcanism could have decreased the global temperature.”
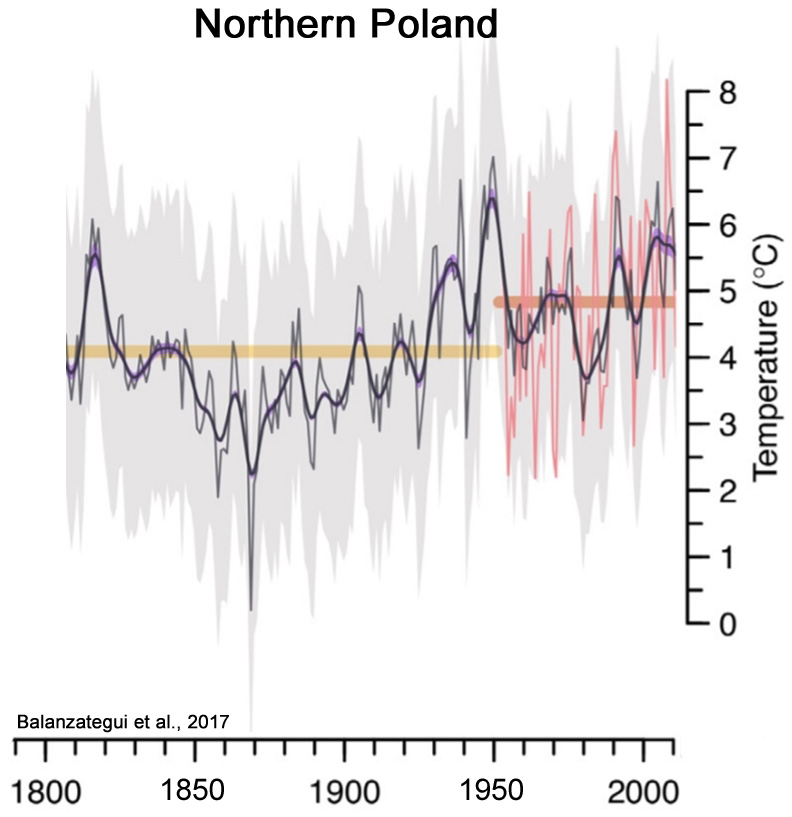
Balanzategui et al., 2017
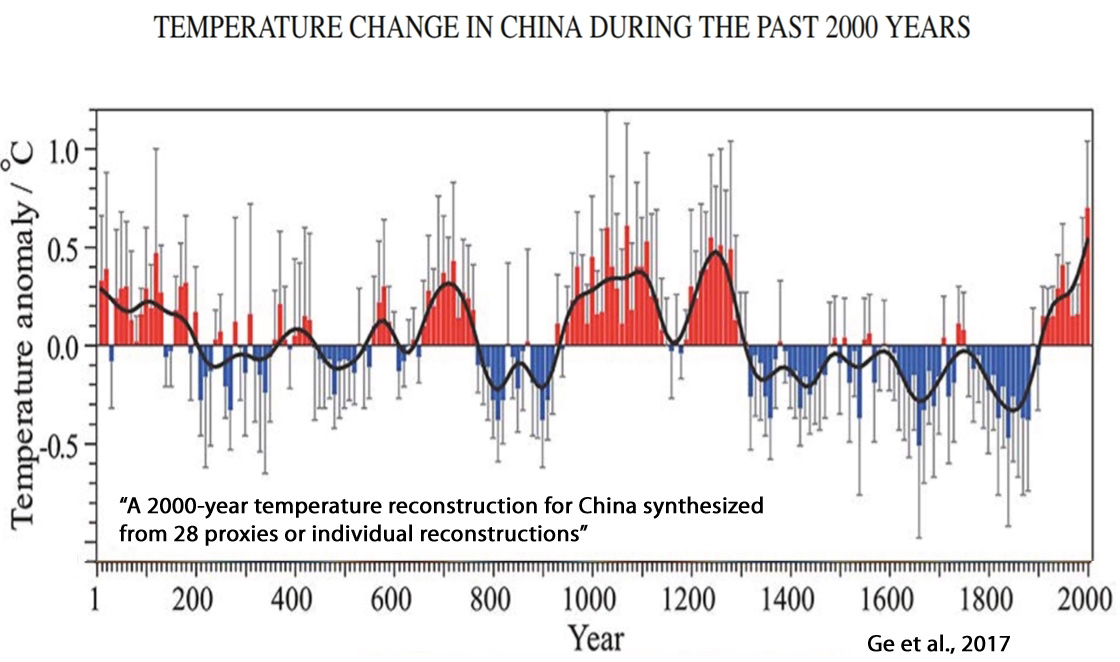
Ge et al., 2017
“This paper presents new high-resolution proxies and paleoclimatic reconstructions for studying climate changes in China for the past 2000 years. Multi-proxy synthesized reconstructions show that temperature variation in China has exhibited significant 50–70-yr, 100–120-yr, and 200–250-yr cycles. Results also show that the amplitudes of decadal and centennial temperature variation were 1.3◦C and 0.7◦C, respectively, with the latter significantly correlated with long-term changes in solar radiation, especially cold periods, which correspond approximately to sunspot minima. The most rapid warming in China occurred over AD 1870–2000, at a rate of 0.56◦ ± 0.42◦C (100 yr)−1; however, temperatures recorded in the 20th century may not be unprecedented for the last 2000 years, as data show records for the periods AD 981–1100 and AD 1201–70 are comparable to the present.”
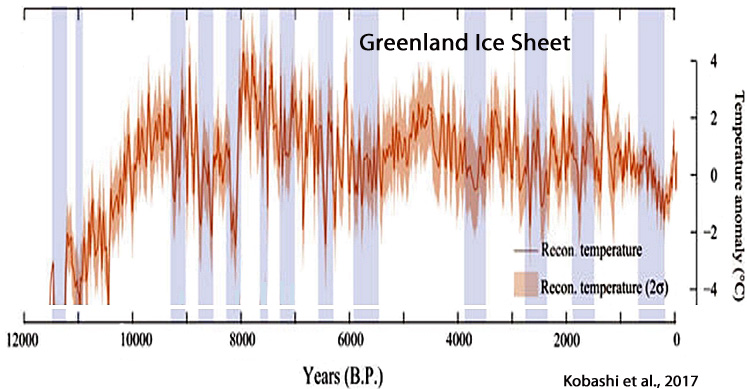
Kobashi et al., 2017
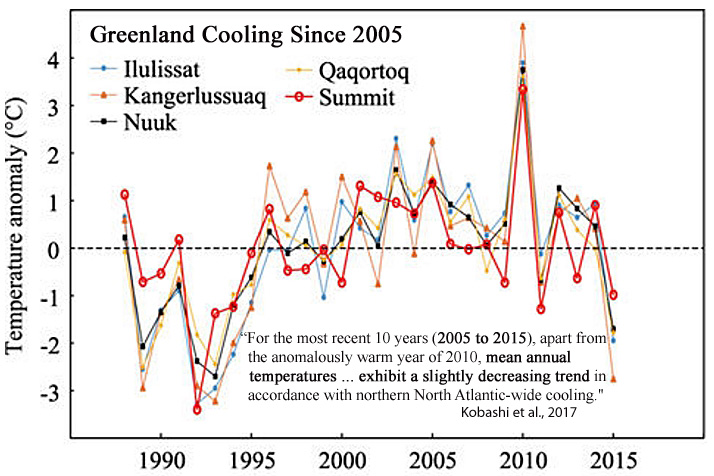
“After the 8.2 ka event, Greenland temperature reached the Holocene thermal maximum with the warmest decades occurring during the Holocene (2.9 ± 1.4 °C warmer than the recent decades) at 7960 ± 30 years B.P. … For the most recent 10 years (2005 to 2015), apart from the anomalously warm year of 2010, mean annual temperatures at the Summit exhibit a slightly decreasing trend in accordance with northern North Atlantic-wide cooling. The Summit temperatures are well correlated with southwest coastal records (Ilulissat, Kangerlussuaq, Nuuk, and Qaqortoq).”
“For the most recent 10 years (2005 to 2015), apart from the anomalously warm year of 2010, mean annual temperatures at the Summit exhibit a slightly decreasing trend in accordance with northern North Atlantic-wide cooling. The Summit temperatures are well correlated with southwest coastal records (Ilulissat, Kangerlussuaq, Nuuk, and Qaqortoq).”
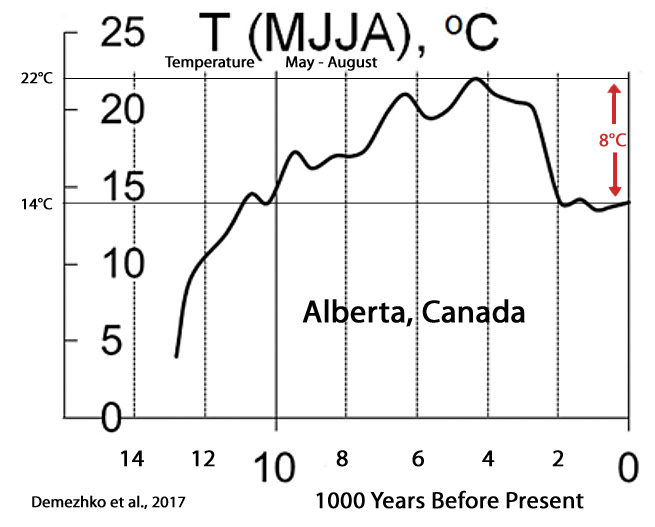
Demezhko et al., 2017
“GST [ground surface temperature] and SHF [surface heat flux] histories differ substantially in shape and chronology. Heat flux changes ahead temperature changes by 500–1000 years.”
Luoto and Nevalainen, 2017

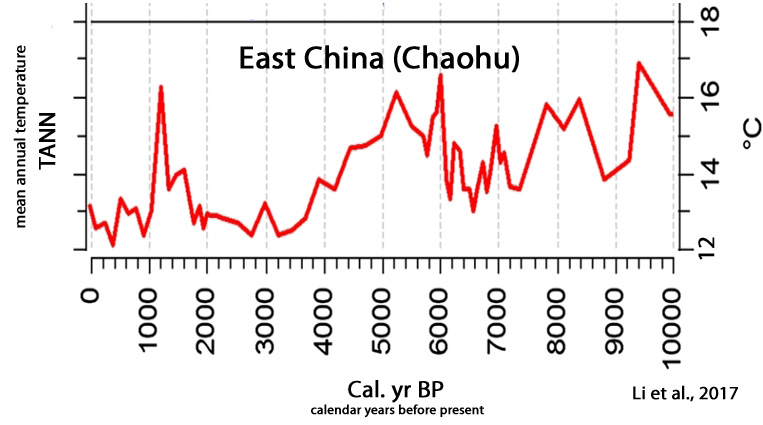
Li et al., 2017
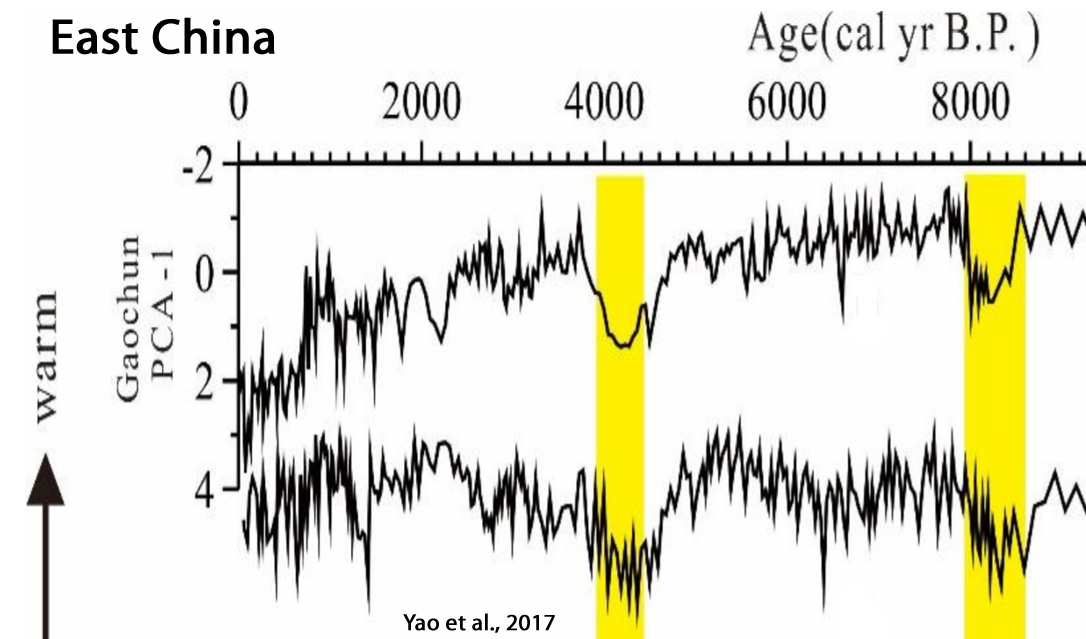
“The main driving forces behind the Holocene climatic changes in the LYR [Lower Yangtze Region, East China] area are likely summer solar insolation associated with tropical or subtropical macro-scale climatic circulations such as the Intertropical Convergence Zone (ITCZ), Western Pacific Subtropical High (WPSH), and El Niño/Southern Oscillation (ENSO).”

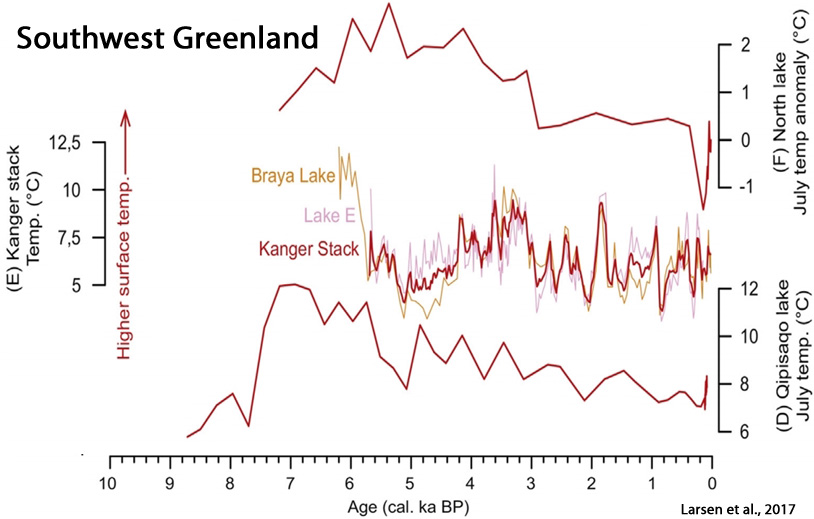
Larsen et al., 2017
“[K]nowledge remains sparse of GICs [glaciers and ice caps] fluctuations in Greenland and whether they survived past warmer conditions than today, e.g. the Holocene Thermal Maximum (HTM) ~8-5 cal. ka BP and the Medieval Climate Anomaly (MCA) ~1200-950 C.E. Only a few available studies have provided continuous records of Holocene glacier fluctuations in east Greenland (Lowell et al., 2013; Levy et al., 2014; Balascio et al., 2015) and west Greenland (Schweinsberg et al., 2017). These records show that local GICs [glaciers and ice caps] were significantly reduced and most likely completely absent during the HTM [Holocene Thermal Maximum].”
Zywiec et al., 2017
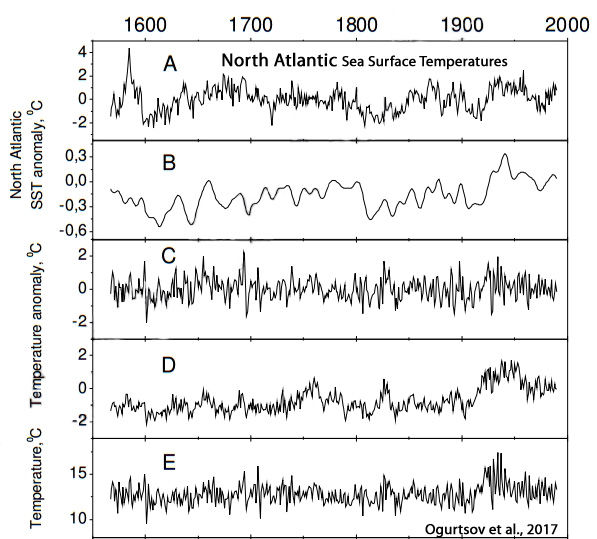
Ogurtsov et al., 2017
“Our analyses reveal appreciable and stable positive correlation between summer temperatures in Northern Fennoscandia and sea surface temperature in North Atlantic over AD 1567–1986. Thus a connection between climates of Northern Fennoscandia and North Atlantic basin is established for more than the last four centuries. Significant correlation was found between SST [sea surface temperatures] in NA [the North Atlantic] and solar activity (both instrumental data and proxies) during AD 1716–1986. … Thus, the connection between Northern Fennoscandian climate and solar activity, which has been previously established at century-scale (Ogurtsov et al., 2001, 2002, 2013) and millennial-scale (Helama et al., 2010), is confirmed for AD 1716–1986 over the entire frequency range using unfiltered records (with the exception for AMO reconstruction after Mann et al. (2009)).”
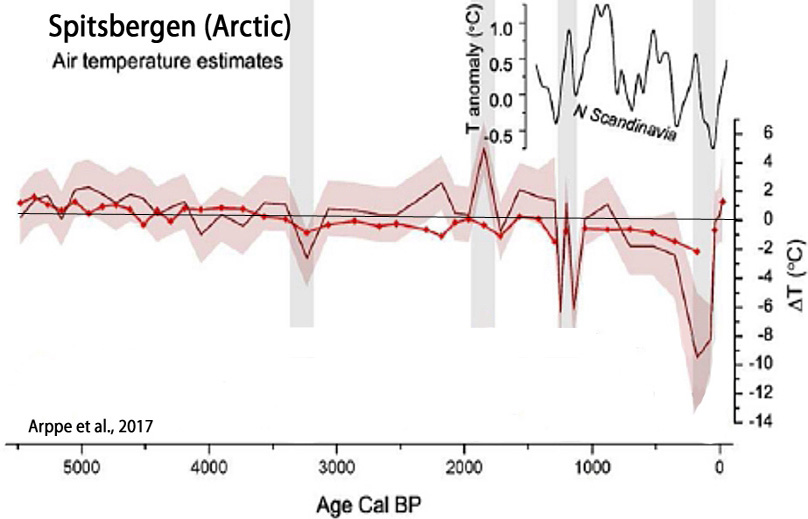
Arppe et al., 2017
“Factoring in respective age-model uncertainties, it appears that all major negative shifts, that is, ‘cold’ periods, in the δ18Olw record are roughly synchronous with periods of major negative anomalies in total solar irradiation and high modeled probabilities for extremely cold years in the Nordic Seas (Renssen et al., 2006), and widespread evidence of North Atlantic ‘cold spells’ (Bond et al., 2001; Sarnthein et al., 2003; Solomina et al., 2015; Wanner et al., 2008) linked to solar forcing.”
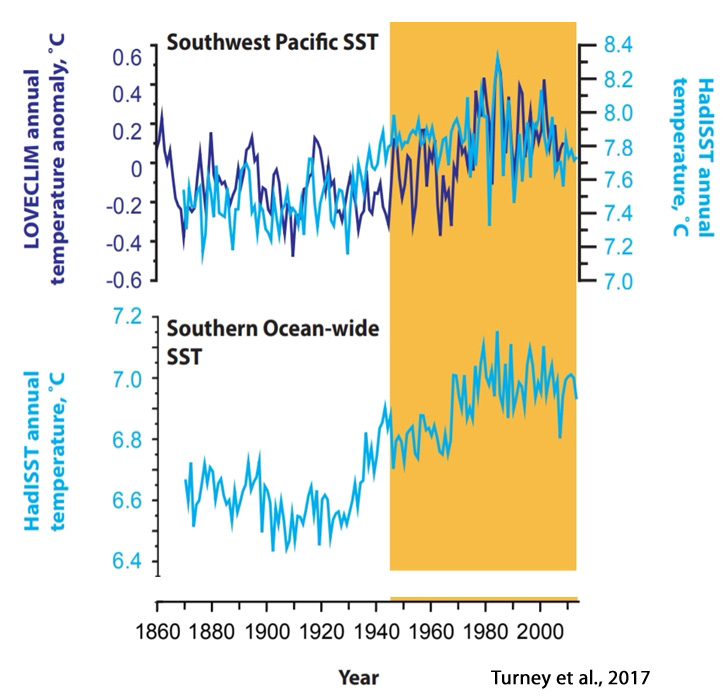
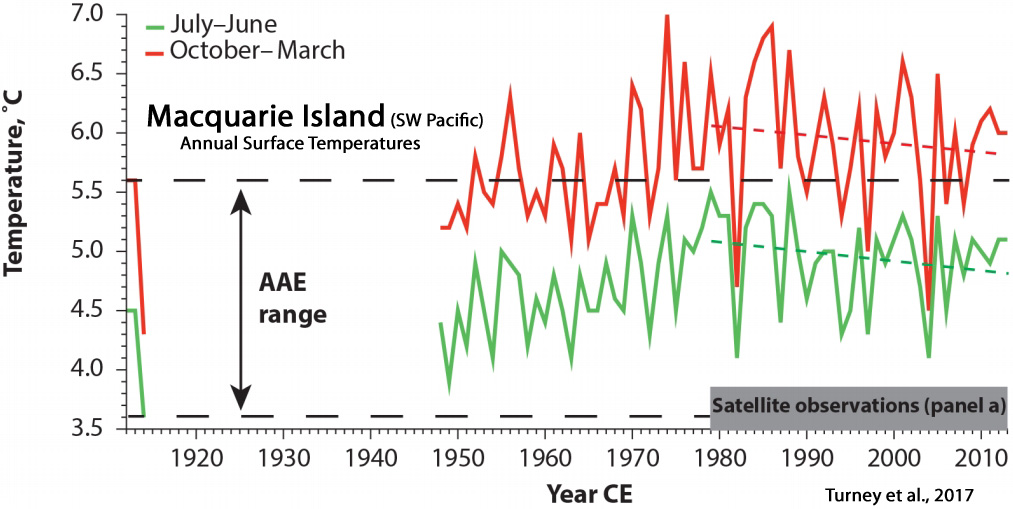
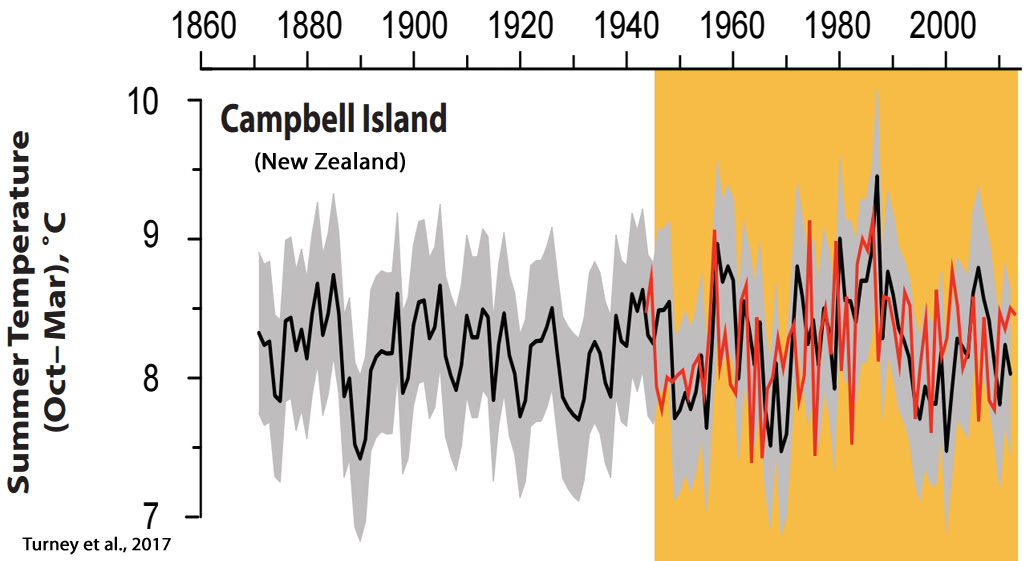
Turney et al., 2017
“Occupying about 14% of the world’s surface, the Southern Ocean plays a fundamental role in ocean and atmosphere circulation, carbon cycling and Antarctic ice-sheet dynamics. … As a result of anomalies in the overlying wind, the surrounding waters are strongly influenced by variations in northward Ekman transport of cold fresh subantarctic surface water and anomalous fluxes of sensible and latent heat at the atmosphere–ocean interface. This has produced a cooling trend since 1979.”
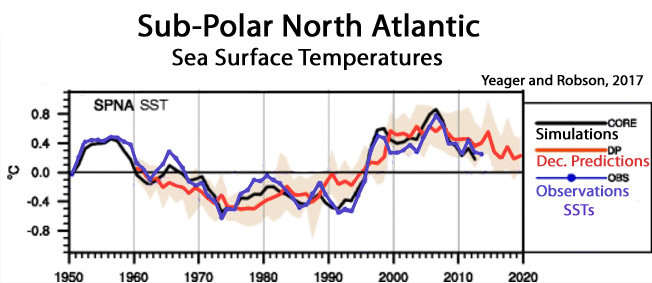
Yeager and Robson, 2017
“[W]hile the late twentieth century Atlantic was dominated by NAO-driven THC [thermohaline circulation] variability, other mechanisms may dominate in other time periods. … More recently, the SPNA [sub polar North Atlantic] upper ocean has again been cooling, which is also thought to be related to a slowdown in the THC. A continued near-term cooling of the SPNA has been forecast by a number of prediction systems, with implications for pan-Atlantic climate.”
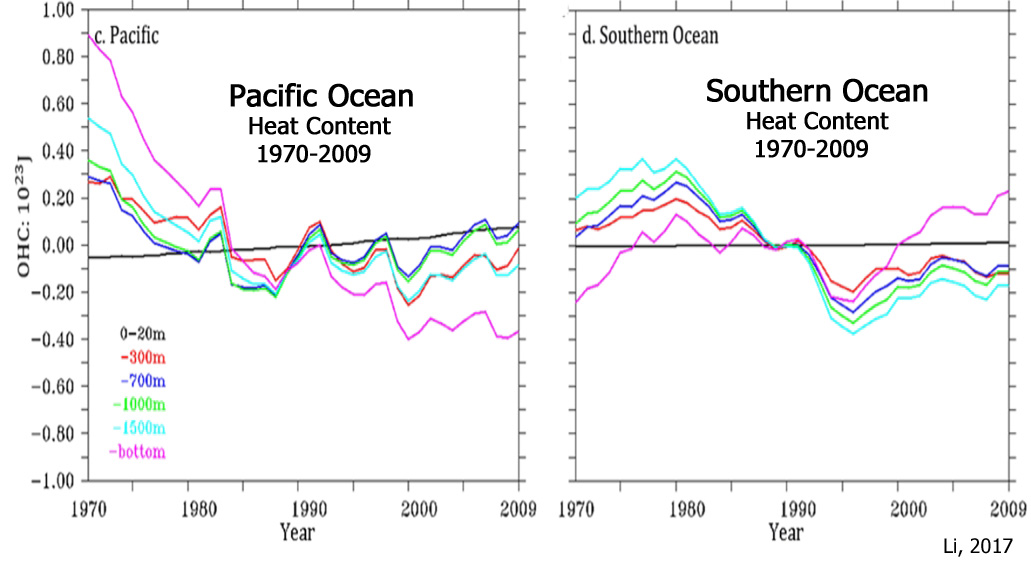
Li, 2017
“In the Southern Ocean, the increasing trend of the total OHC [ocean heat content] slowed down and started to decrease from 1980, and it started to increase again after 1995. In the warming context over the whole period [1970-2009], the Pacific was losing heat, especially in the deep water below 1000 m and in the upper layer above 300 m, excluding the surface 20 m layer in which the OHC kept increasing through the time.”
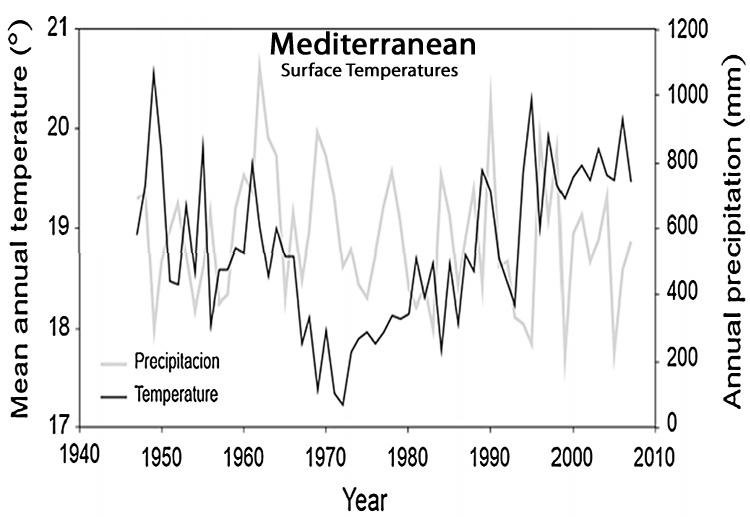
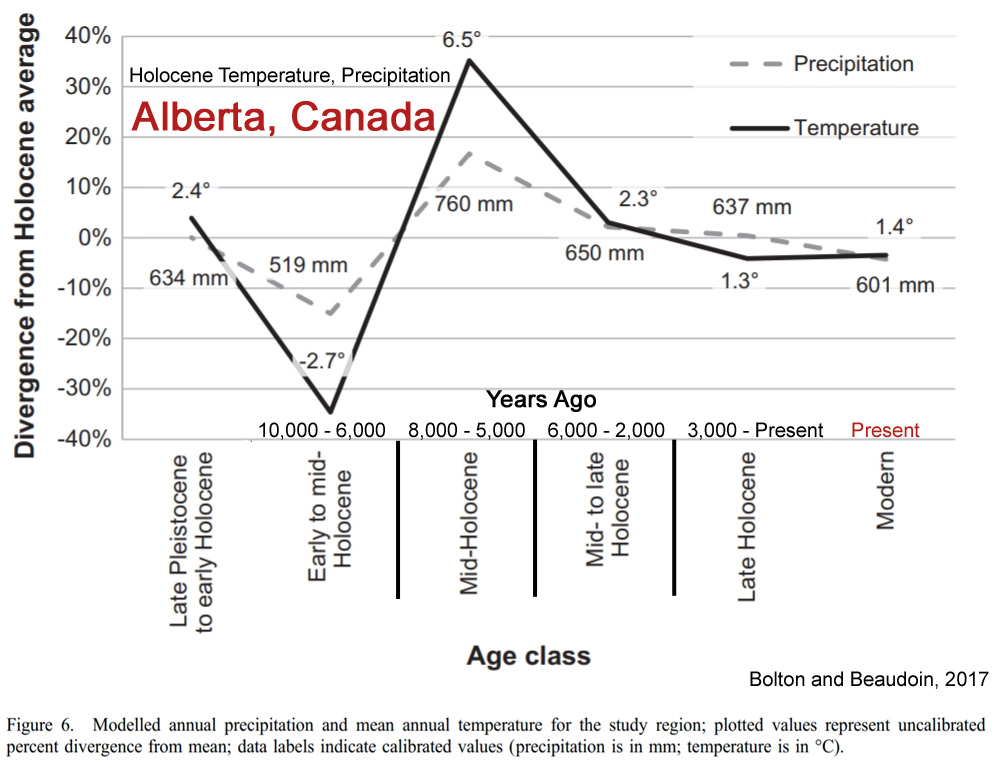
Bolton and Beaudoin, 2017
“Major late Holocene fluctuations include intervals of warmer (e.g. Medieval Warm Period) and cooler (e.g. Little Ice Age) climate. … The modern period [21st century] had temperature and precipitation values which were about 4% less than the Holocene average (Figure 6).”
![]()
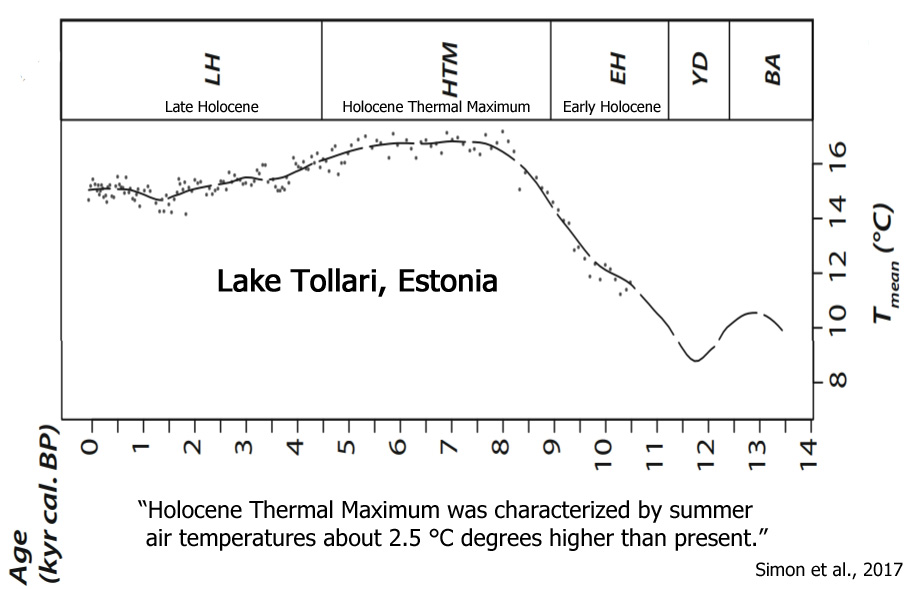
Simon et al., 2017
“The Holocene coldest temperatures were observed during the Early Holocene, but temperature followed a gradual rise (from ca. 11.7 to 8 kyr cal. BP) to reach its maximal value during the Holocene Thermal Maximum (from ca. 8 to 4.5 kyr cal. BP). Holocene Thermal Maximum was characterized by summer air temperatures about 2.5 °C degrees higher than present.”
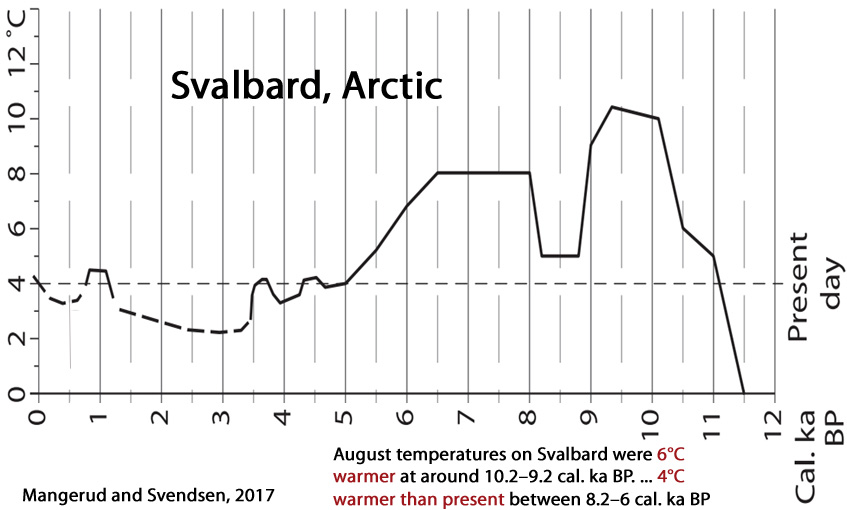
Mangerud and Svendsen, 2017
“Shallow marine molluscs that are today extinct close to Svalbard, because of the cold climate, are found in deposits there dating to the early Holocene. The most warmth-demanding species found, Zirfaea crispata, currently has a northern limit 1000 km farther south, indicating that August temperatures on Svalbard were 6°C warmer at around 10.2–9.2 cal. ka BP, when this species lived there. … After 8.2 cal. ka, the climate around Svalbard warmed again, and although it did not reach the same peak in temperatures as prior to 9 ka, it was nevertheless some 4°C warmer than present between 8.2 and 6 cal. ka BP. Thereafter, a gradual cooling brought temperatures to the present level at about 4.5 cal. ka BP. The warm early-Holocene climate around Svalbard was driven primarily by higher insolation and greater influx of warm Atlantic Water, but feedback processes further influenced the regional climate.”
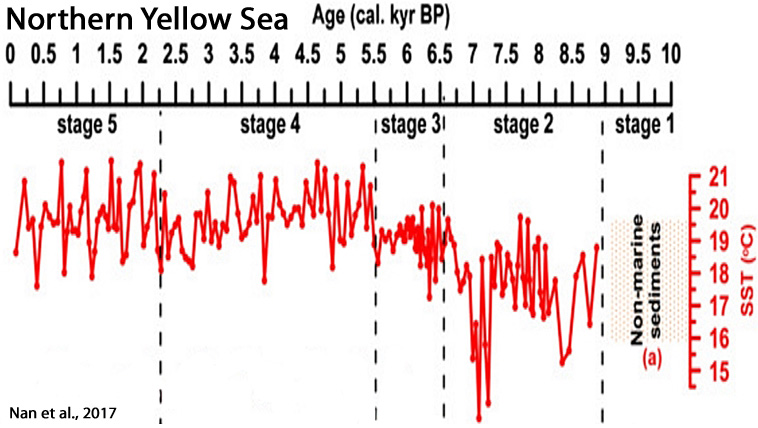
Nan et al., 2017
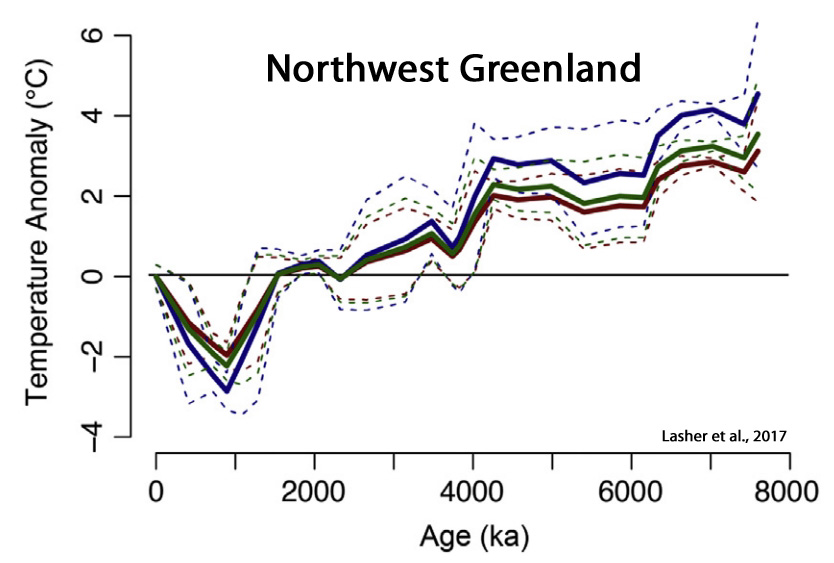
Lasher et al., 2017
“This paper presents a multi proxy lake record of NW Greenland Holocene climate. … Summer temperatures (2.5–4 °C warmer than present) persisted until ∼4 ka [4,000 years ago] … Continual cooling after 4 ka led to coldest temperatures after 1.2 ka, with temperature anomalies 2-3°C below present. Approximately 1000 km to the south, a 2-3°C July temperature anomaly (relative to [warmer than] present) between 6 and 5 ka was reported based upon chironomid assemblages near Illulisat and Jakobshavn (Axford et al., 2013). Across Baffin Bay on northeastern Baffin Island, HTM summer temperatures were an estimated ~5°C warmer than the pre-industrial late Holocene and 3.5°C warmer than present, based upon chironomid assemblages (Axford et al., 2009; Thomas et al., 2007). … Following deglaciation, the GrIS [Greenland Ice Sheet] retreated behind its present margins (by as much as 20-60 km in some parts of Greenland) during the HTM [Holocene Thermal Maximum] (Larsen et al., 2015; Young and Briner, 2015).”
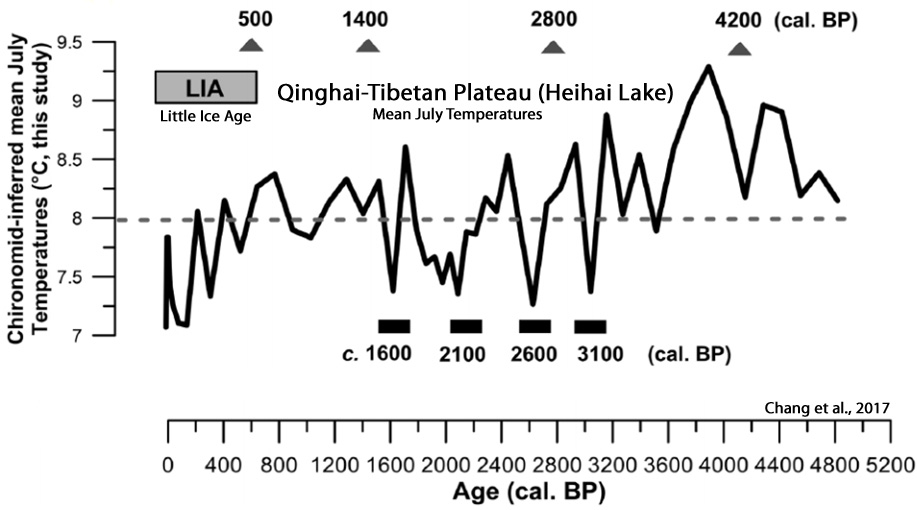
Chang et al., 2017
“The chironomid-based record from Heihai Lake shows a summer temperature fluctuation within 2.4°C in the last c. 5000 years from the south-east margin of the QTP [Qinghai–Tibetan Plateau]. … The summer temperature changes in this region respond primarily to the variation in the Asian Summer Monsoon. The variability of solar activity is likely an important driver of summer temperatures, either directly or by modifying the strength and intensity of the Indian Ocean Summer Monsoon. … We observed a relatively long-lasting summer cooling episode (c. 0.8°C lower than the 5000-year average) between c. 270 cal. BP and AD c. 1956. … The record shows cooling episodes occurred at c. 3100, 2600, 2100 and 1600 cal. BP. This is likely related to the period defined as the Northern Hemisphere Little Ice Age (LIA; c. AD 1350–1850, equivalent to 600–100 cal. BP). These possibly relate to the 500-year quasi-periodic solar cycle. Cooling stages between c. 270 and 100 cal. BP were also recorded and these are possibly linked to the LIA suggesting a hemisphere-wide forcing mechanism for this event.”
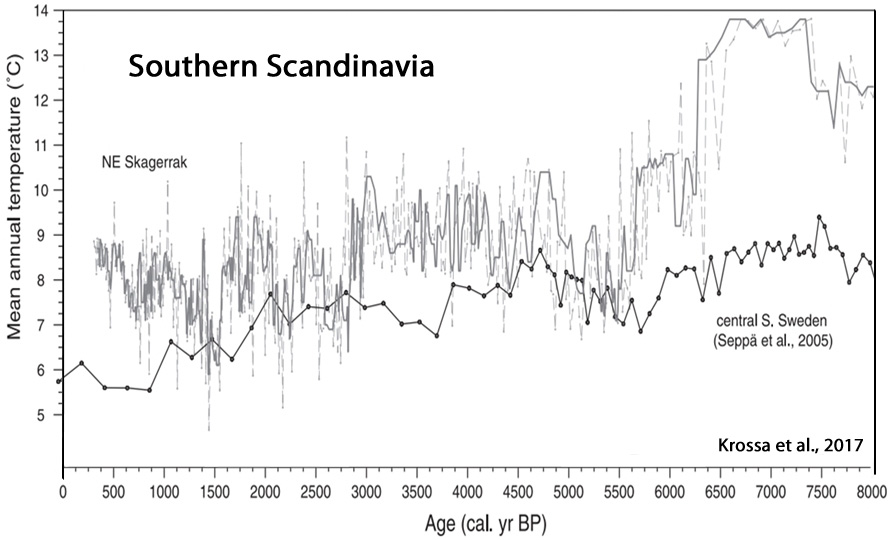
Krossa et al., 2017
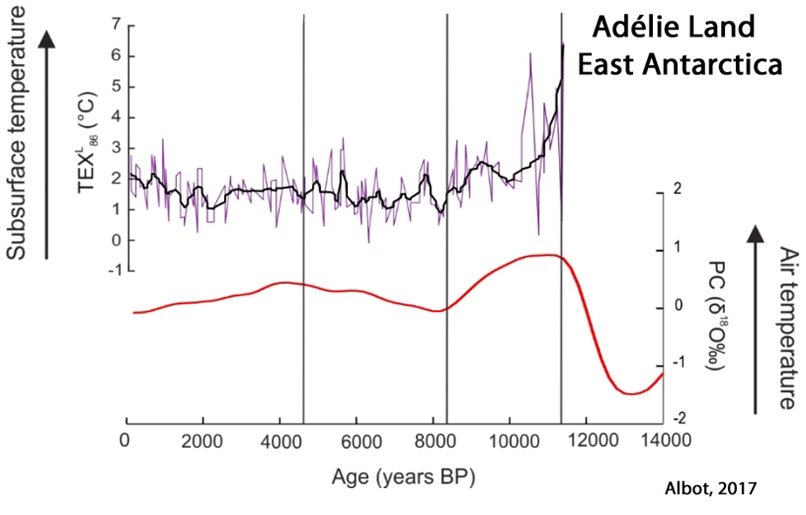
Albot, 2017
“Growing paleoclimatic evidence suggests that the climatic signals of Medieval Warm Period and the Little Ice Age events can be detected around the world (Mayewski et al., 2004; Bertler et al., 2011). … [T]he causes for these events are still debated between changes in solar output, increased volcanic activity, shifts in zonal wind distribution, and changes in the meridional overturning circulation (Crowley, 2000; Hunt, 2006).”
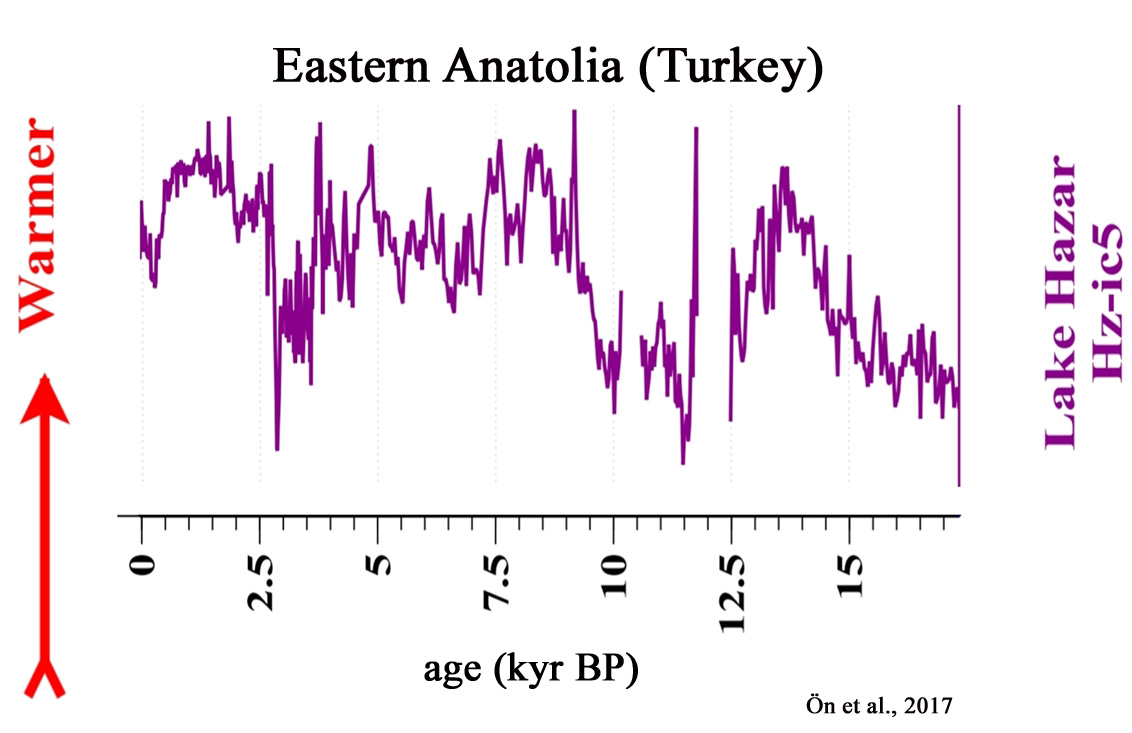
Ön et al., 2017
“[T]he abrupt decline in both precipitation and temperature around 3.5 ka, 2.8 ka and 1.8 ka BP, which were also documented in the seismic records (Eris¸ et al., submitted), may have been the result of a coincidence of the strengthening of the Siberian high pressure system during winters (Rohling et al., 2002; Çagatay et al., 2014), and the gradual decrease in solar irradiance, especially around 2.8 ka BP (Roth and Joos, 2013), in accordance with changes in the North Atlantic (Bond et al., 2001). For the Holocene, the most striking result is that the spikes in precipitation and temperature records appear to closely follow the North Atlantic Bond events, whereas the trends do not. If the cause of the Bond events is indeed solar forcing, as claimed by Bond et al. (2001), then we can also state that the climate oscillations in the region were also greatly influenced by solar forcing.”
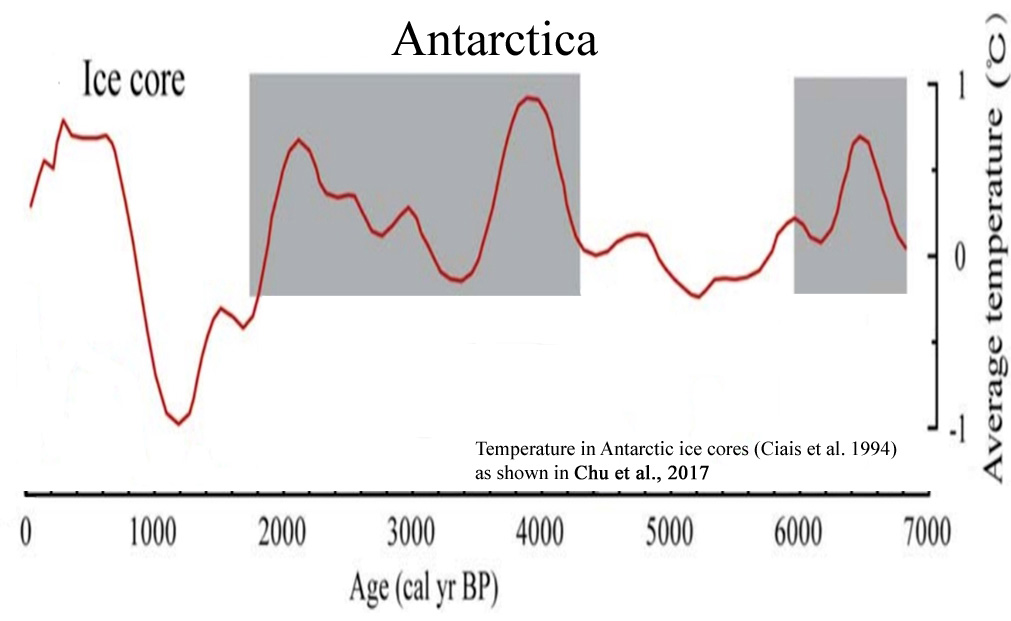
Chu et al., 2017
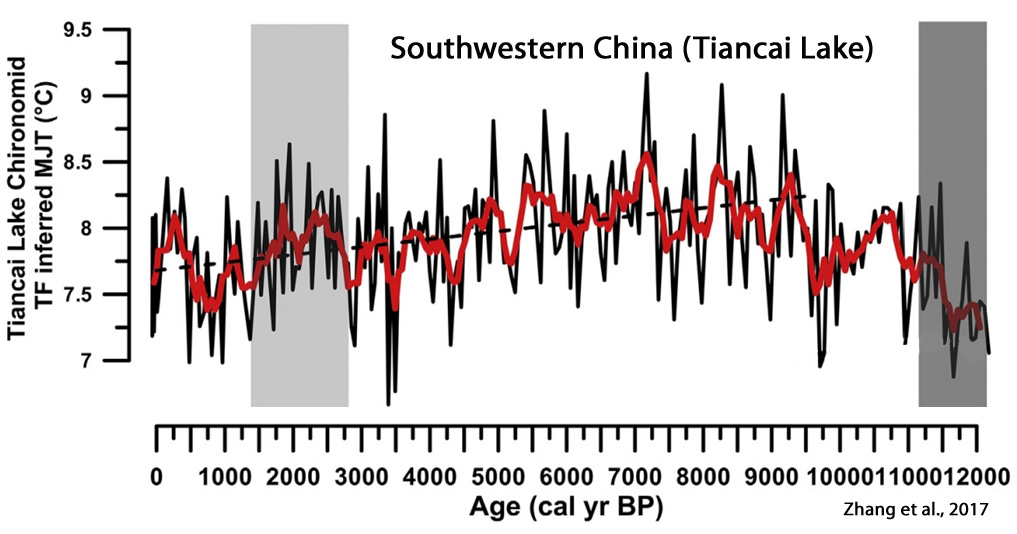
Zhang et al., 2017
“[S]ummer temperature variability at the QTP [Qinghai-Tibetan Plateau] responds rapidly to solar irradiance changes in the late Holocene”
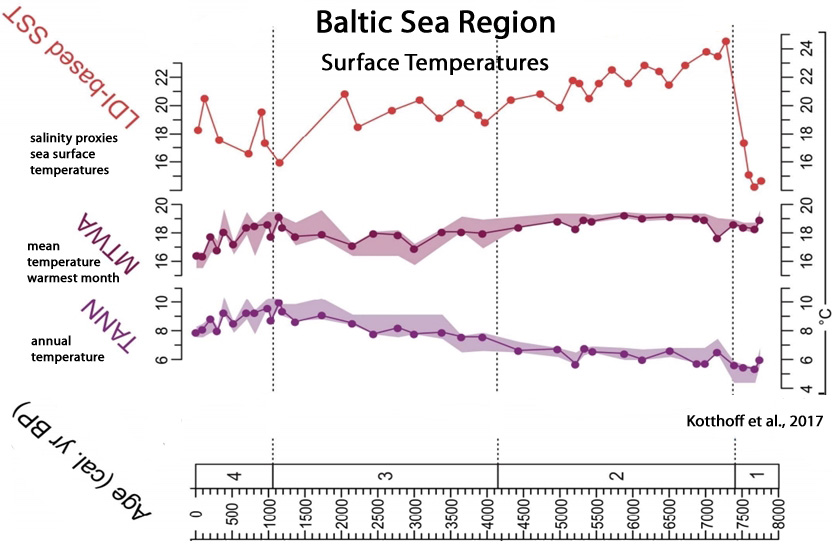
Kotthoff et al., 2017
Yao et al., 2017
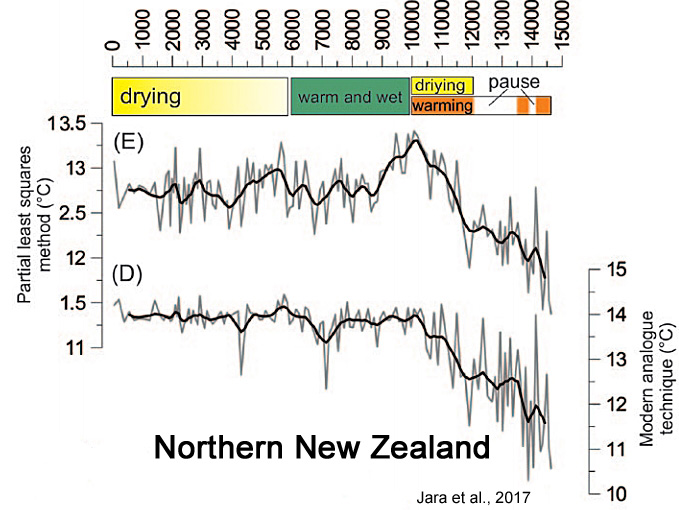
Jara et al., 2017
Zhang et al., 2017

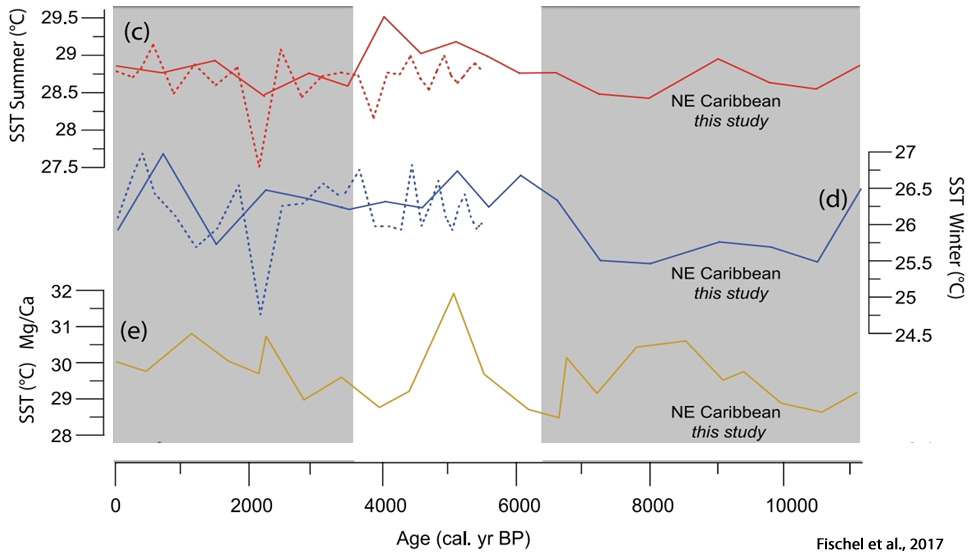
Fischel et al., 2017
Li et al., 2017
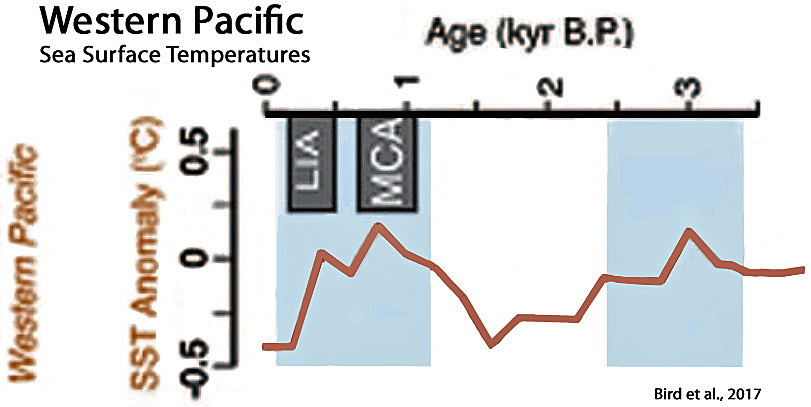
Bird et al., 2017
Dodrill et al., 2017
“These archaeological reconstructions of average palaeo-SST during the 1500–1100 cal BP time-period suggest that the nearshore environments of Palau were slightly warmer than those today by approximately 1–2°C.”

Pendea et al., 2017 (Russia)
“The Holocene Thermal Maximum (HTM) was a relatively warm period that is commonly associated with the orbitally forced Holocene maximum summer insolation (e.g., Berger, 1978; Bartlein et al., 2011). Its timing varies widely from region to region but is generally detected in paleorecords between 11 and 5 cal ka BP (e.g., Kaufman et al., 2004; Bartlein et al., 2011; Renssen et al., 2012). … In Kamchatka, the timing of the HTM varies. Dirksen et al. (2013) find warmer-than-present conditions between 9000 and 5000 cal yr BP in central Kamchatka and between 7000 and 5800 cal yr BP at coastal sites.”
Stivrins et al., 2017 (Latvia)
“Conclusion: Using a multi-proxy approach, we studied the dynamics of thermokarst characteristics in western Latvia, where thermokarst occurred exceptionally late at the Holocene Thermal Maximum. … [A] thermokarst active phase … began 8500 cal. yr BP and lasted at least until 7400 cal. yr BP. Given that thermokarst arise when the mean summer air temperature gradually increased ca. 2°C beyond the modern day temperature, we can argue that before that point, the local geomorphological conditions at the study site must have been exceptional to secure ice-block from the surficial landscape transformation and environmental processes.”
Bañuls-Cardona et al., 2017 (Spain)
“During the Middle Holocene we detect important climatic events. From 7000 to 6800 [years before present] (MIR 23 and MIR22), we register climatic characteristics that could be related to the end of the African Humid Period, namely an increase in temperatures and a progressive reduction in arboreal cover as a result of a decrease in precipitation. The temperatures exceeded current levels by 1°C, especially in MIR23, where the most highly represented taxon is a thermo-Mediterranean species, M. (T.) duodecimcostatus.”
Reid, 2017 (Global)
“The small increase in global average temperature observed over the last 166 years is the random variation of a centrally biased random walk. It is a red noise fluctuation. It is not significant, it is not a trend and it is not likely to continue.”
Åkesson et al., 2017 (Norway)
“Reconstructions for southern Norway based on pollen and chironomids suggest that summer temperatures were up to 2 °C higher than present in the period between 8000 and 4000 BP, when solar insolation was higher (Nesje and Dahl, 1991; Bjune et al., 2005; Velle et al., 2005a).”
Molnár and Végvári, 2017 (SE Central Europe)
“Our study provides an estimate for the value of MAT of HTM of Pannon region with an interval of 0.4°C, relying on macroecological considerations. We calculate the temperature of the HTM [Holocene Thermal Maximum] 1.3–1.7°C warmer than the present temperature.”
Lusas et al., 2017 (East Greenland)
“The lack of glacio-lacustrine sediments throughout most of the record suggests that the ice cap was similar to or smaller than present throughout most of the Holocene. This restricted ice extent suggests that climate was similar to or warmer than present, in keeping with other records from Greenland that indicate a warm early and middle Holocene. Middle Holocene magnetic susceptibility oscillations, with a ~200-year frequency in one of the lakes, may relate to solar influence on local catchment processes. … Air temperatures in Milne Land, west of our study area, based on preliminary estimates from chironomids, may have been 3–6°C warmer than at present (Axford et al. 2013), and in Scoresby Sund itself, warm ocean fauna, including Mytilus edulis and Chlamys islandica, both of which live far to the south today, occupied the fjords (Sugden and John 1965; Hjort and Funder 1974; Street 1977; Funder 1978; Bennike and Wagner 2013; Fig. 13). … Recession of Istorvet ice cap in the last decade has revealed plant remains that show that the glacier was smaller than at present during the early stages of the Medieval Warm Period, but expanded during the late Holocene ca. AD 1150 (Lowell et al. 2013).”
Hu et al., 2017 (Yellow River, China)
“According to the pollen records in the HRYR [Headwater Region of the Yellow River], the climate in the Holocene thermal maximum was warmer and wetter than present (temperature was 2 -3 °C higher than present)“

![]()
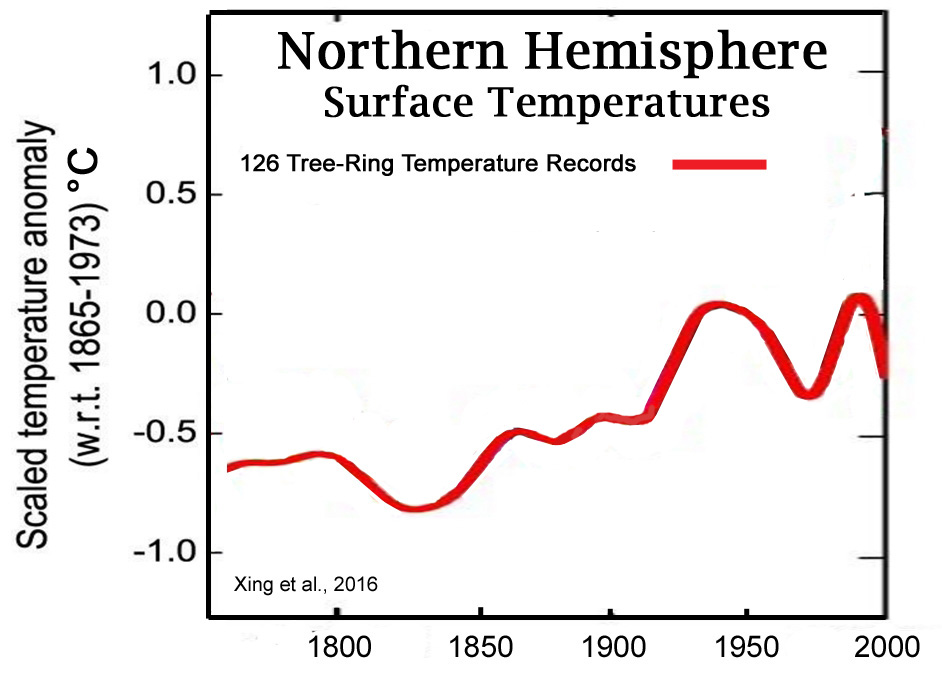
Xing et al., 2016 as adapted from Figure 7
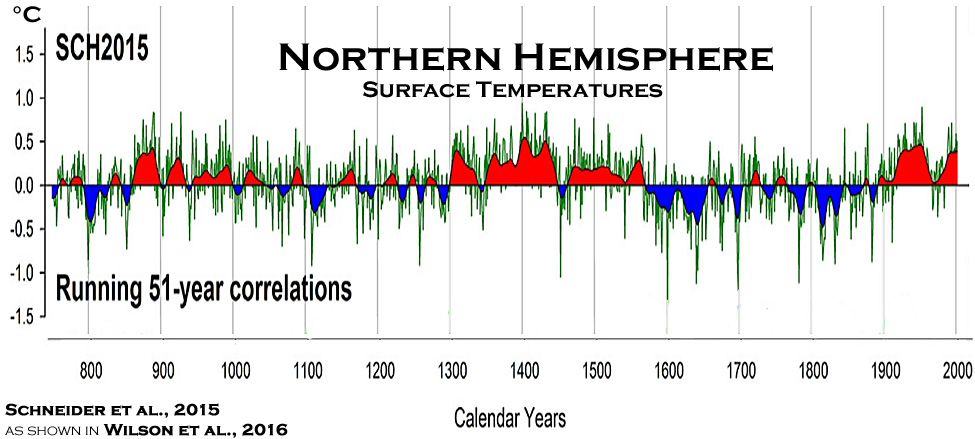
Wilson et al., 2016
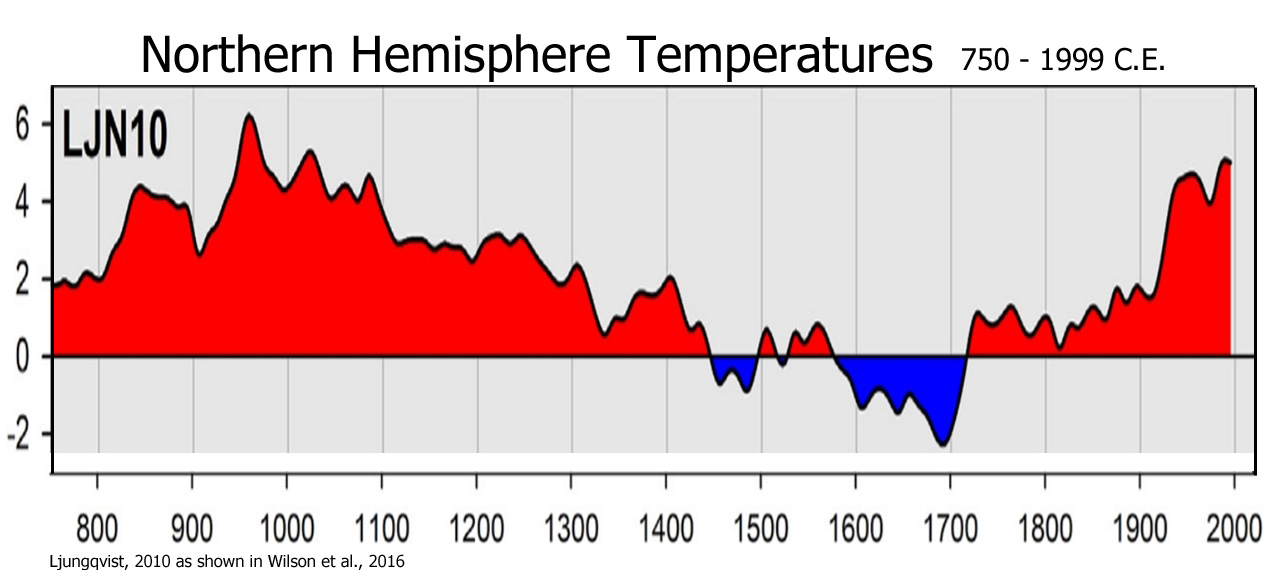
Ljungqvist, 2010


Hola
I would like to know your opinion about geoengineering and climate manipulation,please.Thank You.
Beatriz,
Hola
I would like to know whether you even bothered to read this article or ANY of the abstracts from the 88 or so papers presented, please. Thank you.
Hola
I have read a lot
others do not understand them.Graphics, for example
Maybe i can not understand
the translation is from google translate
Thank you
Hi, Beatriz
I think you deserve a reply which is less Kurt.
Perhaps you are new to the Sceptic blogoshere and to Pierre’s excellent site. Geoengineering is indeed a bit off-topic because the contributors here are, for the most part, quite unimpressed with the need for geoengineering, or indeed any other remedy for the warming ‘problem’. Indeed, most of us think that we are going along just fine, fossil fuels helping us greatly along the way.
This post, by the tireless Kenneth Richard, assembles yet more evidence that the present modest warming is nothing unusual. The CAGW story against which we fight needs this warming to be UNPRECEDENTED. You will often hear it said that it is unprecedented. Well, it isn’t, and Kenneth ceaselessly and methodically assembles hundreds of peer-reviewed papers that show it is not in any sense unprecedented. Without that it is unprecedented, the warmist camp has a near-insuperable problem in ATTRIBUTION of the warming to human interference with the climate. And so the whole CAGW idea fails.
Kenneth has amassed a great weight of evidence (much more evidence than the warmists have!) in this matter. Now, it is true that science is not a set of scales, and lots of evidence doesn’t necessarily make a theory right or wrong, but what it does prove – to me anyway – is that the oft-repeated claim that ‘the science is settled’ is far, far, far from the truth. You’ll hear it repeated everywhere, and it has entered into the climate folklore – but it’s a lie. Pure and simple – it’s a lie.
Good luck with your enquiries into geoengineering, but rest assured it is very unlikely indeed to be necessary.
I’m sorry my Spanish is nowhere up to the level necessary to translate this – I do hope I have helped a little.
My previous answer was for
mothcatcher 29. septiembre 2017 a las 10:58 AM | Permalink | Respuesta
I just want to inform myself and draw my own conclusions before what I see and listen. I am not an expert in these subjects, I am not at their level, therefore it is difficult
I dedicate myself to other issues in my life
As the total understanding and knowledge about climate is at best patchy, I would say “geoengineering and climate manipulation” is attempting to run before you know how to stand-up let alone walk.
What we apparently know, and the UN-IPCC agrees, is our climate system is a chaotic system.
I contend our climate, as currently known, has chaotic elements within it but it also has confounding ‘noisy’ inputs e.g. solar events, volcanic events, cosmic events (cosmic rays, meteorites, cosmic dust, etc.,). Our chaotic subsystems may be less than perfectly chaotic thus will not be deterministic!
The upshot is we have a climate system which has a bunch of loosely linked coupled element that mostly act in non-linear ways, while being affected and affecting some elements’ behavior within less than perfectly chaotic subsystems.
Therefore in truth our climate system can not be judged to be truly chaotic or deterministic at this time.
Thus when throwing some geoengineering and climate manipulation into the mix how do assess how all that will affect the planets climate? I cannot see how the long term effects of such manipulations can be properly assessed.
What I like is the fact that these papers are mostly if not completely independent of each other,yet come to similar conclusions. They separately used divergent proxies to do it.
While those few h.s. papers supposedly in support of Dr. Mann’s absurd 1998 “hockey stick” paper,which enjoyed an awful lot of pal support papers using similar methods Mann used.
Still see warmists not learning from past WRITTEN climate history showing that the MWP and LIA epochs were real and significant departure from what we enjoy today.
Hmmmmm…..what changed since the new year??? Could it be that the Obama Administration is gone now and academics world wide see that there is a changing tide in the sentiment of society?? I think so!!
Hola
You are certainly attentive, at least. Patient
It is difficult to expose everything when it is in another language
I have read and published articles from this blog for days
Doubts about climate change dissipated.
Climate change is an excuse
My doubt:
Do they use Geoengineering as a climatic weapon?
Every day I see the sky from my house full of wakes that are not normal
I have seen the clouds of rain dissipate before my eyes.
¿You understand?
Thank you
Oh Dios!
Sorry, but the Google translation is not right
Incorrect
I just want to inform myself and draw my own conclusions before what I see and listen. I am not expert in these subjects, I am not at their level, therefore it is difficult
Corrected
I’m not at your level in the weather
I dedicate myself to other subjects
Impossible to translate
Anyway. Thank you by space.
I do not bother but here
https://www.facebook.com/Luzdelagua
[…] by K. Richard, September 28, 2017 in NoTricksZone […]
[…] Read more at: https://notrickszone.com/2017/09/28/update-the-2017-explosion-of-non-hockey-stick-graphs-continues/#s… […]