If you’re looking for the 2019 Facebook stats online sellers need to know, you’ve come to the right place.
Why?
Because looking at the stats and numbers of this top advertising platform can help point you to areas where you should be putting your marketing budget and time.
In this post, we’ve collected the most relevant 2019 Facebook stats to boost your Facebook marketing strategy inspiration and point to areas where you could invest more to increase sales.
1. Facebook Earned $55 Billion in Advertising Revenue, Mostly Coming from Mobile
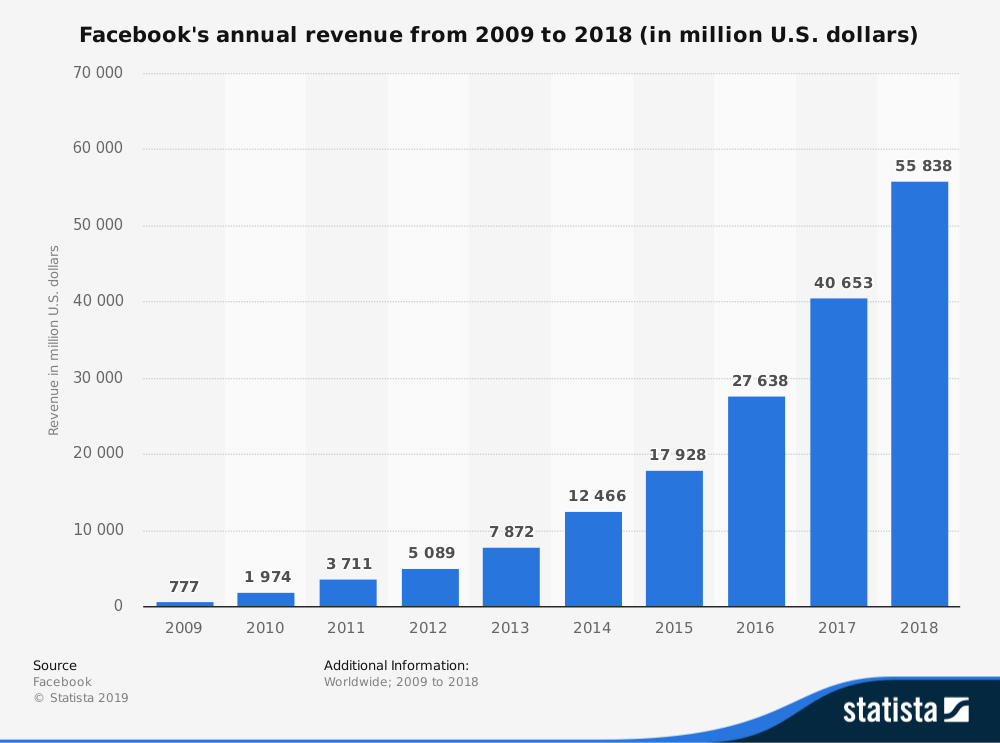
Despite its 2018 data scandal, Facebook still increased its revenue by just over 37% in 2018, almost all of which was generated from advertising revenue. And that’s not just any old revenue; they reported that 93% of their fourth-quarter revenue last year came from mobile advertising alone.
What does this mean for online sellers?
You can be sure your competitors are not only putting their budget into mobile placement but optimizing their ads (images and text) for mobile first.
2. It’s Estimated That There are Over 80 Million Active Facebook Business Pages
With 80 million businesses on Facebook, can you afford not to streamline your targeting? According to Hootsuite’s 2018 Global Barometer Report, as many as 98% of B2C and 89% of B2Bs use Facebook ads. Competition goes hand in hand with a profitable niche, but the key to standing out from Facebook content noise and reaching potential customers lies in smaller, more targeted campaign segments. Here are four Facebook Custom Audience strategies to help boost reach and sales.
Bonus Content: 4 Ways to Beat Your Competitors’ Facebook Ads
3. 39% of Facebookers Follow Business Pages to Get Offers
What can make someone choose to follow your page over those of your biggest competitors’? Your follow value. The most significant way you can offer something in exchange for their follow and/or engagement is with special offers.
In a Kentico survey, they found that a whopping 68% of users ignore the brands they follow on Facebook. However, 39% were more likely to follow and engage with a brand to get exclusive offers.
Pro Tip: Looking for a Facebook follower benchmark? The average monthly page like increase is around 0.15%.
A good example of an online clothing store brand using promotions to add value for their Facebook followers is One Kid.
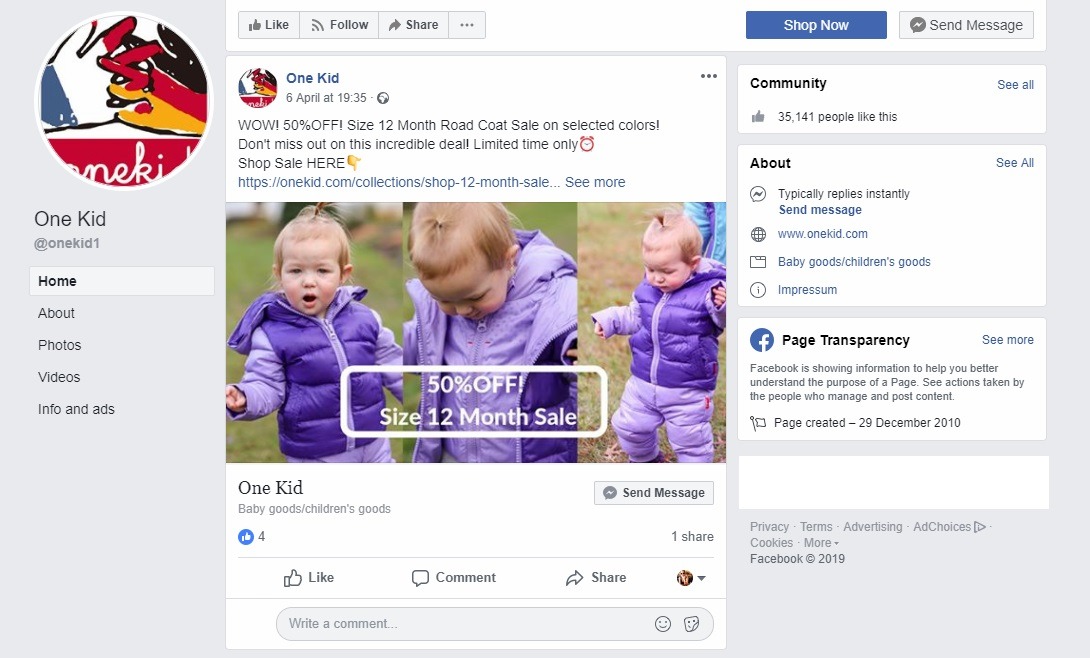
To find out what other strategies they used to help their brand go viral and increase revenue, check out their success story interview.
4. On Average, Your New Content is Likely to Reach Only 8.1% of Your Followers Organically
This means that for every piece of organic content you post to your Facebook page, it’s likely that only around 8.1% of your followers will see it organically.
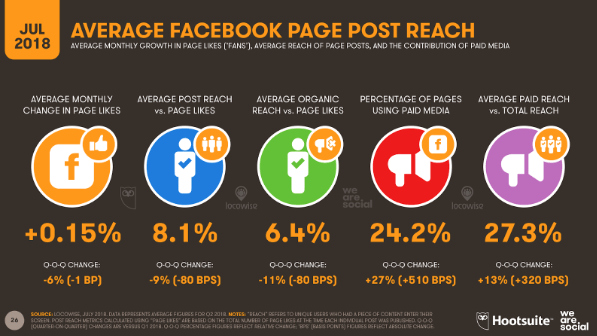
[Source: We Are Social]
This is not to say you shouldn’t be investing time in high-value, low-‘hard sell’ content for your Facebook page. Facebook organic content definitely has its place in terms of adding value, which helps with branding and gaining more followers. It’s also important to note that smaller Facebook pages generally have higher reach and engagement rates.
Here are a few ways you can boost your Facebook content’s organic reach:
- Leverage video content and Facebook Lives
- Avoid clickbait and find content that appeals to your target audience specifically
- Choose quality over quantity

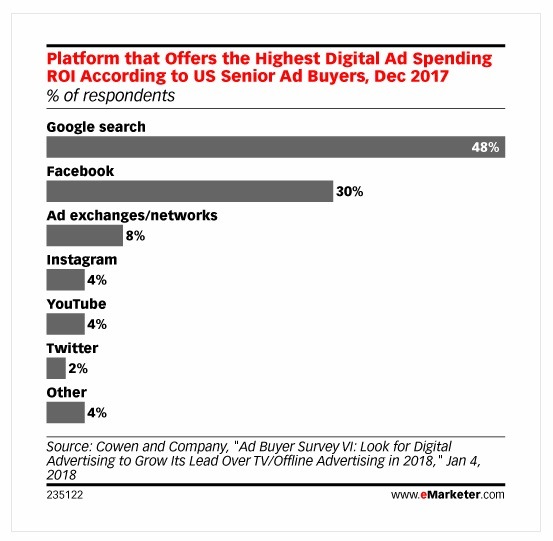
5. 78% of Marketers Report Best ROIs from Facebook and Google
According to eMarketer, 30% of marketers say that Facebook ads afford them higher ROIs than other platforms. What about the other 70%?
This means that by creating a seamless Google and Facebook marketing strategy, you can boost your eCommerce traffic to expert level. Looking for tips on creating the perfect cross-platform marketing plan? Then this sales-driving Google and Facebook strategy is just what you need.
Bonus Content: Crush Your ROIs With These 7 Facebook Ad Hacks
6. Facebook CTRs Have Tripled for eCommerce Marketers
In another Hootsuite study, they found that over the global eCommerce CTRs have risen from 1% to 3%. This means that although marketers are spending more per year on Facebook, they are also getting more clicks (traffic) on average for their ads.
In HubSpot’s paid search and social benchmark report, they go a step further and break down average CTRs into different content types. They analyzed around 3 billion ad impressions and 66 million clicks to determine these mediums for 2018. They found that the:
- Newsfeed CTR median was 2.24%
- Audience CTR median was 0.82%
- Messenger CTR median was 0.60%
- Instagram CTR median was 0.62%
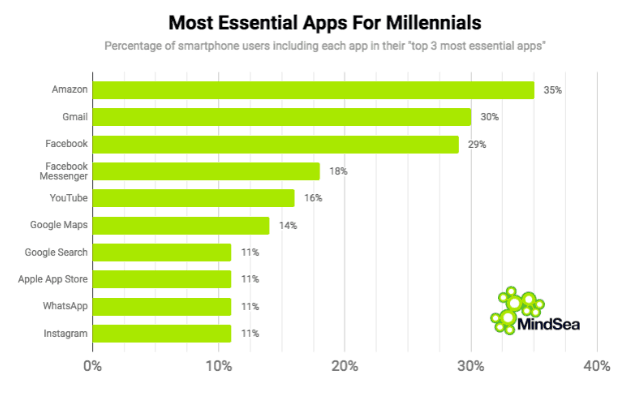
7. Despite Facebook Messenger Leading App Use, Only 31% of Businesses Use it
Facebook Messenger is a leading mobile app in terms of downloads. However, only 31% of businesses are using Messenger in their Facebook campaign strategies.
This is surprising when you look at the case studies on their potential. For example, marketing expert influencer Neil Patel was able to get an 88% open rate and 56% CTRs from his Facebook Messenger experiments. The key to using Messenger to get ahead of the curve lies in using chatbot tech to your advantage. Here are some great eCommerce chatbots as inspiration.
Beginner Tip: New to Facebook Messenger ads? Check out our full Messenger Guide.
8. Users Only Click 8-10 Facebook Ads Per Month
Another interesting Facebook stat from the We Are Social report we’ve highlighted is that a Facebook user will click on eight ads per month. Considering there are millions of brands running a million ads, how do you ensure your target shopper clicks your ad? Here are some of our top tips:
- Run optimized remarketing campaigns
- Segment your campaigns
- A/B test ad components to find the winning combination
Want to find out how we were able to increase a brand’s CTRs by 470% using Facebook and Google combined strategies? Find out here!
9. Facebook Video Is Content King
BuzzSumo analyzed 500 million Facebook posts to get engagement insights into content types – finding video gets more shares than any other post type.
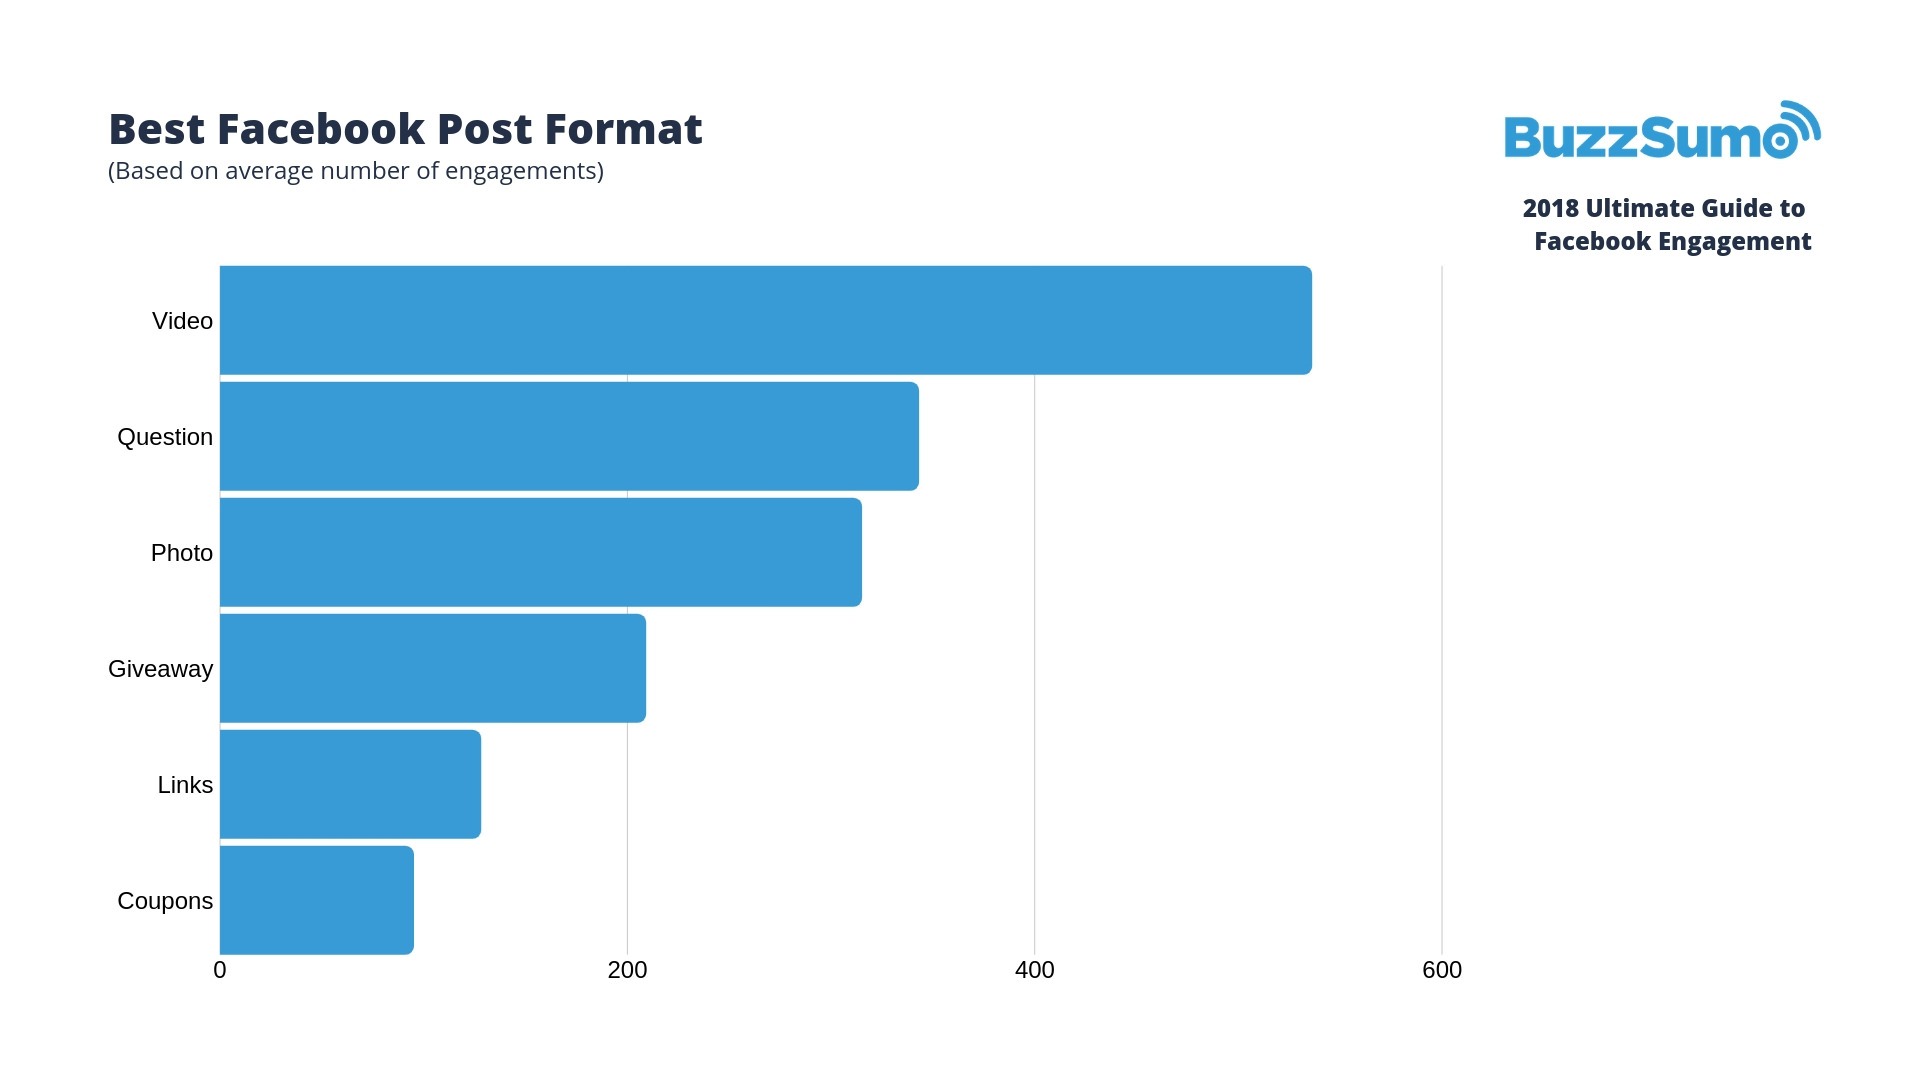
But you already knew that video is content king on Facebook. Let’s look at some Facebook video case study stats you are less likely to know, that could help you optimize your Facebook video content.
- Video is the best way to discover products, say 30% of mobile shoppers
- Increase video time by 12% with closed captions
- 80% of Facebook users say auto-playing videos with sound are annoying
- Video has an average engagement rate of around 6%
- You have just three seconds to capture attention with videos
- In 2018, Facebook owned 24.5% of all video ad spend
- Facebook videos can increase brand awareness by 67%
10. Facebook Group Membership is up 40%
In a recent Forbes article, they reported that Facebook group memberships were up by 40% in recent years, with group member numbers sitting at around 200 million. Brands can take a risk and capitalize on closed Facebook groups to engage directly with potential and current customers. The secret, though, is ensuring that a group appeals to your target shopper and provides content they would most likely respond to.
One such eCommerce brand example is 7-figure store Glam Guru, who uses their group to promote new products and answer beauty questions while giving their customers a forum to swap products, advice, and recommendations.
Bonus Content: 31 Must-Join eCommerce Facebook Groups
11. 66% of Facebook’s 2 Billion Users Use the Platform Daily
Of Facebook’s 2.32 billion users, around two-thirds (66%) visit the platform daily, while as many as 47% of their MAU (monthly active users) only access the platform through the mobile app. According to a report, each of these Facebook visits is short, lasting around 10-12 minutes. That’s a limited amount of time to ensure your organic and paid content makes an impact.
12. Facebook Audience Stats to Help With Targeting
Lastly, let’s look at some more detailed stats with regard to Facebook users to help with your segmentation strategies.
- Facebook recently announced the removal of 583 million fake accounts
- 1.1 billion Facebook users speak English
- 10% of users are American and spend an average of 58 minutes per day on the platform
- 43% of US Facebook users report getting their news from Facebook first
- 78% of US consumers discover products on Facebook
- Facebook users who are 65+ have doubled to 41% since 2012
- The percentage of Facebook users under 25 is 35%
—
There you have it, the 2019 Facebook stats online sellers need to know. Stats that will help you plan your Facebook marketing strategies and give you insights into how to optimize your Facebook campaigns for more reach, clicks and sales.
Have Facebook PPC campaign questions? Post them in the comments below – our traffic gurus are standing by!

Nicole is a content writer at StoreYa with over sixteen years experience and flair for storytelling. She runs on a healthy dose of caffeine and enthusiasm. When she's not researching the next content trend or creating informative small business content, she's an avid beachgoer, coffee shop junkie and hangs out on LinkedIn.
Recommended articles
 Facebook Ads for eCommerce: 16 Strategies, Examples & Tips
 How to Build a Winning eCommerce Ads Strategy
 Google Ads for eCommerce: Everything You Need to Know
 10X Your Traffic with PPC Management Software
Comments
Powered by Facebook Comments